HL/2 Fast & Slow - Cloud Signals + Backtest + Exit AlarmsDescription:
This indicator plots two HL/2 moving averages—a fast and a slow line—on the chart, along with dynamic upper and lower bands based on the slow line and ATR. It features a colored cloud between the two averages to visualize trend direction, and it provides buy/sell signals based on the alignment of the two lines.
Key Features:
Fast & Slow HL/2 Averages
Fast and slow HL/2 lines calculated as simple moving averages.
Lines change color based on direction (up/down), configurable via style settings.
Dynamic Upper and Lower Bands
Bands calculated from the slow line using ATR to capture volatility.
Trend Cloud
Fills the area between fast and slow lines.
Green if both lines are rising, red if both are falling, gray if lines disagree.
Transparency adjustable for better visual clarity.
Buy/Sell Signals
Signals appear only when both lines align in the same direction.
Two modes available:
Series Signals: generates a signal whenever the cloud color changes.
Single Signal: generates a signal only when the slow line changes direction.
Signals are plotted as small triangles above/below bars.
Alerts can be set for both buy/sell signals.
Exit Modes and Alerts
Exit positions either on a reverse signal or when the cloud enters a neutral gray zone.
Exit alerts are available for both conditions.
Integrated Backtest Panel
Shows total trades, win rate, and cumulative profit in USD.
Considers position size and commission (configurable).
Panel color indicates profit (green) or loss (red).
Fixed position on chart for easy reference.
Inputs:
Fast and slow periods, ATR length, ATR multiplier.
Position size, commission percentage.
Signal mode (Series or Single).
Exit mode (Reverse Signal or Gray Area).
Style options for line colors and cloud colors.
Time window for backtesting (daily, weekly, monthly, or custom date range).
Usage:
Ideal for identifying trend direction and potential entry points.
Can be used for manual trading or as part of an automated strategy with alerts.
Provides a visual and statistical overview of trading performance via the backtest panel.
Candlestick analysis

Developing Midpoint TrackerDeveloping Midpoint Tracker (DMT)
Original Concept: This indicator tracks key midpoint levels from either session opens or custom timeframe periods, providing precise reference levels for intraday trading decisions.
Dual Tracking Modes:
Session Mode: Tracks midpoints from a specific session start time (e.g., 1800 ET electronic trading open) with full timezone support
Timeframe Mode: Tracks midpoints from any custom timeframe (15m, 1H, 4H, etc.) using higher timeframe OHLC data via request.security()
Core Calculations:
The indicator calculates three distinct midpoint levels:
Open-to-High Midpoint: (Session/Timeframe Open + Highest High) / 2
Open-to-Low Midpoint: (Session/Timeframe Open + Lowest Low) / 2
High-to-Low Midpoint: (Highest High + Lowest Low) / 2
Visual Features:
Horizontal lines extending from the reference period start with customizable colors, styles, and extension length
Smart collision detection prevents duplicate lines at identical price levels
Price labels with transparent backgrounds showing exact values
Optional reference open price line
Real-time info table displaying current mode and all calculated levels
Technical Implementation:
Uses Pine Script's native time() function for accurate session detection across multiple timezones
Employs request.security() for reliable higher timeframe data access
Implements proper line and label management to prevent memory issues
Supports 13 major global timezones including US markets, Europe, and Asia
Use Cases:
Identifying potential support/resistance levels from key price relationships
Setting profit targets and stop levels based on mathematical price midpoints
Analyzing price behavior around session or timeframe-specific reference levels
Multi-timeframe analysis when using custom timeframe mode on lower timeframe charts
This indicator is particularly useful for traders who utilize midpoint reversion strategies or need precise reference levels derived from session or timeframe opens.

Volume Threshold Levels - Crypto LidyaVolume Threshold Levels – Crypto Lidya
Understanding volume behavior is one of the most effective ways to detect trend changes, manipulation candles, aggressive entries, and institutional activity.
Volume Threshold Levels (VTL) not only displays raw volume but also calculates dynamic volume thresholds (2x – 3x – 4x) based on the moving average, allowing you to identify statistically meaningful volume anomalies with precision.
📌 1. Volume Columns
The indicator plots each bar’s volume using traditional column-style visualization.
Green: Bullish candle
Red: Bearish candle
Gray: Neutral candle
This helps traders clearly understand the relationship between price and volume.
📌 2. Average Volume Area
VTL offers two types of moving averages for volume:
SMA (Simple Moving Average)
EMA (Exponential Moving Average)
The average volume is drawn as a soft yellow area across the chart.
This area acts as the baseline for normal volume levels.
📌 3. Dynamic Threshold Lines (2x / 3x / 4x)
The script calculates and displays multipliers of the average volume:
2x Average
3x Average
4x Average
These levels appear as bright yellow lines.
They are extremely useful for identifying breakouts, traps, and aggressive institutional entries.
📌 4. Volume Spike Detection (Alerts)
VTL identifies upward crossovers where volume breaks above key levels:
1x Volume Signal
2x Volume Signal
3x Volume Signal
4x Volume Signal
These can be used directly as TradingView alerts.
This allows you to automate detection of high-impact volume spikes.
📌 5. Use Cases
The indicator performs exceptionally well in:
Breakout confirmation
Liquidity sweep analysis
Detecting manipulation candles
Combining with OB, FVG, or other SMC structures
Scalping and low-timeframe aggressive volume interpretation
Algorithmic filters for volume-based strategies
📌 6. Summary
VTL delivers:
✔ Dynamic average volume baseline
✔ Clear 2x–3x–4x volume thresholds
✔ Accurate detection of upside volume explosions
✔ A strong tool for traders who rely on volume confirmation
Completely open-source and ready to be extended.

CODY BOT – Breakout SignalsCODY BOT is a minimalist, high-probability breakout indicator designed to keep your chart clean while highlighting actionable trading opportunities.
Unlike traditional indicators that generate too many signals, CODY BOT only alerts you to strong directional moves following consolidation, helping you focus on high-quality entries.
Key Features:
Detects breakouts above recent highs and below recent lows.
Filters weak moves using minimum candle body size.
Includes a cooldown period to prevent signal spam.
Clean and intuitive visual signals with large arrows for easy interpretation.
Optional customization for consolidation lookback bars, minimum candle size, and arrow visibility.
Alerts built-in for server-side and mobile notifications.
How to Use:
Look for BUY arrows when price breaks above consolidation highs.
Look for SELL arrows when price breaks below consolidation lows.
Combine with your preferred risk management and trend confirmation strategies.

5% Move Counter (Up vs Down)5% Move Counter (Up vs Down)
This indicator tracks how many times a stock has made a 5% or larger move in a single session, and shows the count separately for up days and down days. It’s meant for traders who want quick context on whether a stock has a history of making large moves, instead of manually scrolling through years of price action.
Most tools only tell you what’s happening right now. This one helps you understand what the stock is capable of.
What it shows
Number of 5%+ up days
Number of 5%+ down days
Optional display modes:
All
Up Only
Down Only
Why it’s useful
Different stocks behave differently. Some give clean, powerful bursts when they break out, while others rarely move big even when the setup looks perfect. This tool helps you gauge a stock’s historical “explosiveness” so you can decide whether your strategy fits its behavior.
If your setups depend on volatility or momentum, it helps to know whether the stock has produced big moves before. This gives you that information instantly.
Customization
You can place the stats box anywhere on the chart using a simple 1–9 selector.
You can hide the rows you don’t need through a dropdown.
When a row is hidden, its background becomes fully transparent so the chart stays clean.
Who it’s for
Short-term traders, breakout traders, swing traders, and anyone who wants a quick read on whether a stock moves enough to justify certain types of trades.

Gap Zones with Unfilled AreasA very efficient scalping strategy for BTC. Both for the sell and buy. Take the trade when the price retraces back into 50% of the zone and and aim for a an easy 1:2


Sree Daily RangeVery simple indicator to draw support and resistance levels given the price. It creates a given lebel at the level

SYXX - HTF Candle Overlay
This script, titled "HTF Candle Overlay by SYXX," is designed to visualize the full range and structure of a higher-timeframe (HTF) candle directly onto a lower-timeframe chart. It helps traders maintain context by showing where the current price action sits relative to a much larger candle's boundaries. Combined with LuxAlgo Volume Node Profile.
1. 🔍 Primary Feature: Higher Timeframe Candle Projection
Configurable Timeframe: The user sets the desired HTF using the Interval input, which defaults to 'D' (Daily). The indicator then tracks the High, Low, Open, and Close of that HTF bar.
Live and Historical Drawing: The script uses box.new to draw boxes representing the candle's full range (High to Low).
Historical Boxes (if changeHTF): When a new HTF candle closes, the completed box for the previous period is drawn.
Live Box (if barstate.islast): The indicator draws a live, dynamic box for the current, incomplete HTF candle, which expands with every new High or Low on the lower chart.
2. 🎨 Visualization & Customization
Color-Coded Bias: The boxes are colored based on the HTF candle's direction:
Bullish/Long (BgLong): Green color is used if the HTF candle closed higher than it opened (close > htfOpen).
Bearish/Short (BgShort): Red color is used if the HTF candle closed lower than it opened.
Box Styling: Users can customize the box's appearance, including border color and style, border thickness, and background opacity (BoxOpacity).
Midline: An optional MidLine is calculated as the average of the HTF High and Low, acting as a potential support/resistance reference point.
Range Display: The indicator can display the range of the box in pips (BoxRangePips) or the percentage of movement relative to the full range (BoxRangePercentage).
Time Labels: It plots time labels that show the start and end time of the completed HTF period (e.g., "07:00 - 11:00").
3. 🚨 Alert System (Placeholders)
The script includes placeholder inputs for standard trading alerts, though the internal logic for checking these conditions is currently commented out or set to false:
Alert: Break Above/Below Box: To signal a breakout of the HTF High or Low.
Alert: Price Re-Enters Box: To signal a pullback back into the range.

Smart Non-Overlapping S/R How to Interpret This Chart
The "Cluster" Effect: Look for areas where lines from different timeframes are close together (e.g., a Daily Support line is right next to a 4-Hour Support line). These "clusters" are very strong zones where price is highly likely to bounce.
Breakouts:
Bullish Breakout: If a candle closes above a Resistance line (e.g., "Daily Res"), that line often turns into new Support.
Bearish Breakout: If a candle closes below a Support line (e.g., "Daily Sup"), that line often turns into new Resistance.
Color Coding:
Orange (Daily): Major levels. Expect big reactions here.
Purple (4H): Medium trend levels. Good for swing trades.
Blue (1H): Minor levels. Good for day trading entries.

Clean Day End TradingThis script visualizes the complete Clean Box Breakout framework.
It automatically detects the intraday boundary window, builds a dynamic High/Low box, and locks levels at boundary close.
Features include:
• Dynamic boundary High/Low with optional historical day-1 & day-2 levels
• Automatic box visualization and real-time level updates
Ideal for traders who want clean, visual confirmation of the breakout model without running a strategy.

AI Kernel Regression StrategyHow to Use This Strategy
Paste the Code: Open the Pine Editor, paste the code, and click "Add to chart".
Look for Reversals:
BUY Signal: The price dipped below the green band (oversold) and snapped back up. The script identifies this as a high-probability bounce.
SELL Signal: The price spiked above the red band (overbought) and snapped back down.
Adjust the "Lookback Window":
In the settings (gear icon), if you change Lookback Window to a higher number (e.g., 15-20), the lines become smoother (better for trends).
If you lower it (e.g., 3-5), it becomes very reactive (better for scalping).
Important Note on "Repainting"
This script uses a technique called Regression. In live trading, it works perfectly (the signal appears when the candle closes). However, be aware that "AI" scripts like this are heavy on calculations. If you refresh your browser, the historical lines might shift slightly to fit the data better. Always wait for the candle to close before taking the trade to ensure the signal is locked in.

Daily High-Low-Open + LabelsSimple PDH/PDL/DO indicator. It is in horizontal line form and it includes labels. So you don't have to place them daily yourself. Updates on its own every single day.

Smoothed Heiken Ashi Candles9-SMA Trading Method (Buy and Sell Rules)
Sell Rules
A candle closes above.
Buy Rules
A candle closes below the 9-SMA.

TCT OBIF Detector█ OVERVIEW
The OBIF (Order Block Imbalance Fill) indicator automatically detects and visualizes high-probability trading zones by combining two powerful Smart Money Concepts: Order Blocks and Fair Value Gaps (FVGs).
An OBIF occurs when an Order Block forms immediately before a Fair Value Gap, creating a zone of institutional interest that price often revisits before continuing its move.
█ CONCEPTS
Order Block (OB)
An Order Block is the last opposing candle before a strong directional move. It represents an area where institutional traders likely placed orders.
- Bullish OB: Last bearish candle before an up-move
- Bearish OB: Last bullish candle before a down-move
Fair Value Gap (FVG)
An FVG is a price imbalance created when a candle's body completely gaps past the previous candle's range, leaving an unfilled area.
- Bullish FVG: Gap up where candle .low > candle .high
- Bearish FVG: Gap down where candle .high < candle .low
OBIF Zone
When an Order Block directly precedes an FVG, it creates an OBIF - a confluence zone with higher probability of acting as support/resistance.
█ HOW TO USE
1. Identify the Trend
Use OBIFs in the direction of the higher timeframe trend for best results.
2. Wait for Price to Return
OBIFs act as magnets - price often returns to fill the imbalance and test the order block.
3. Look for Confirmation
When price enters an OBIF zone, look for:
- Rejection wicks
- Engulfing patterns
- Break of structure on lower timeframes
4. Mitigation
Once price fully trades through the OBIF (touches the opposite edge), the zone is considered mitigated and loses its significance.
█ FEATURES
- Automatic Detection — Identifies OBIFs in real-time as they form
- Visual Zones — Clean, non-intrusive boxes that don't obscure price action
- Mitigation Tracking — Zones automatically update when price mitigates them
- Multi-Timeframe Friendly — Works on any timeframe from 1m to Monthly
- Customizable — Adjust colors, opacity, and display preferences
█ SETTINGS
- Lookback Window — How many candles back to search for the Order Block (default: 3)
- Show Bullish/Bearish — Toggle visibility of each type
- Show Mitigated — Display zones that have been mitigated (shown in gray)
- Fill Opacity — Adjust zone transparency (higher = more see-through)
- Border Width — Thickness of zone borders
█ BEST PRACTICES
✓ Use on higher timeframes (1H+) for more reliable zones
✓ Combine with market structure analysis
✓ Look for OBIFs at key support/resistance levels
✓ Use lower timeframe confirmation for entries
✗ Don't trade every OBIF blindly
✗ Avoid OBIFs against the dominant trend
█ CREDITS
The Composite Trader (TCT) methodologies.

CharisGold FX Dashboard v2.8 (Signals + Alerts)this strategy is a trend line follower using EMA LOW (2 3 6 9) for scalping EMA LOW(25 34 89 110 355 and 480 )for trend direction

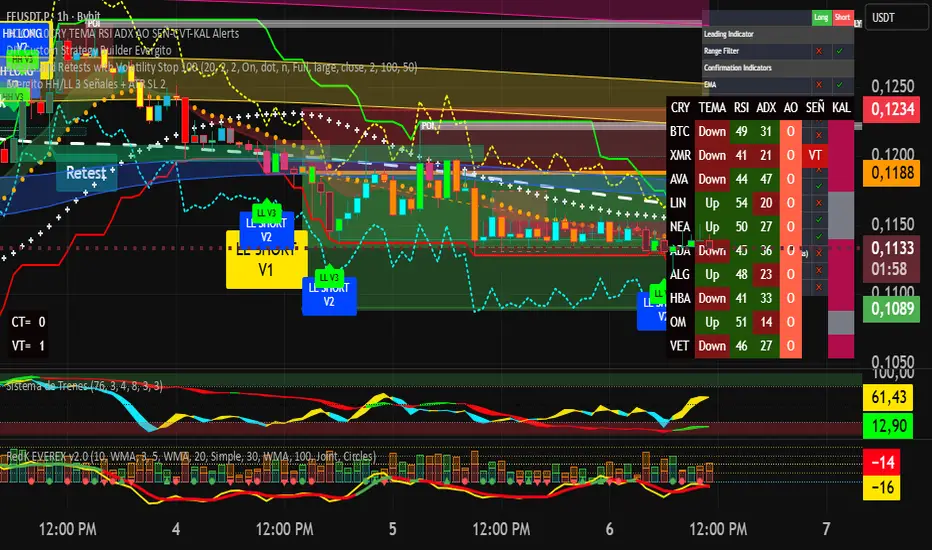
Evergito HH/LL 3 Señales + ATR SL 2How to trade with the Evergito HH/LL 3 Signals + ATR SL indicator? Brief and direct explanation: General system logic: The indicator looks for actual breakouts of the high/low of the last 20 bars (HH/LL) and combines them with the position relative to the 200 SMA to filter the underlying trend. You have 3 types of signals that you can activate/deactivate separately: Signal
When it appears
What it means in practice
Entry type
V1
HH breakout + the close crosses above the 200 SMA (or the opposite in a short position)
Very safe entry confirmed. The price has just validated the long/flat trend → safer and with a better ratio
The most reliable (the original)
V2
HH breakout but the price was already above the 200 SMA (or already below in a short position)
Entry in an already established trend. Fewer “surprises”, more continuity
Ideal for strong trends
V3
Only the breakout of the HH or LL, without looking at the 200 SMA
Aggressive entry/scalping on explosive breakouts. More signals, more noise.
For times of high volatility.
How to enter the market (simple rule): Wait for any of the 3 labels (V1, V2, or V3) to appear, depending on which ones you have activated.
Enter at the close of that candle (or at the open of the next one if you are conservative).
Automatic Stop Loss → the blue (long) or yellow (short) line that represents the ATR x2.
Take Profit → you decide, but the indicator already gives you the visual reference for the risk (ATR x2), so 1:2 or 1:3 is usually very convenient.
Practical example: You see a large green label “HH LONG V1” → you go long at the close of that candle. Stop right at the blue line (ATR x2 below the price).
Typical target: 2x or 3x the risk (very common to reach it in a trend).
Recommended use: Most traders leave only V1 activated → fewer signals but very high quality.
Those who trade intraday or crypto usually combine V1 + V2.
V3 only for news events or very volatile openings.
In summary:
Label = immediate entry
Blue/yellow line = automatic stop
And enjoy the move.
Evergito HH/LL 3 Señales + ATR SLHow to trade with the Evergito HH/LL 3 Signals + ATR SL indicator? Brief and direct explanation: General system logic: The indicator looks for actual breakouts of the high/low of the last 20 bars (HH/LL) and combines them with the position relative to the 200 SMA to filter the underlying trend. You have 3 types of signals that you can activate/deactivate separately: Signal
When it appears
What it means in practice
Entry type
V1
HH breakout + the close crosses above the 200 SMA (or the opposite in a short position)
Very safe entry confirmed. The price has just validated the long/flat trend → safer and with a better ratio
The most reliable (the original)
V2
HH breakout but the price was already above the 200 SMA (or already below in a short position)
Entry in an already established trend. Fewer “surprises”, more continuity
Ideal for strong trends
V3
Only the breakout of the HH or LL, without looking at the 200 SMA
Aggressive entry/scalping on explosive breakouts. More signals, more noise.
For times of high volatility.
How to enter the market (simple rule): Wait for any of the 3 labels (V1, V2, or V3) to appear, depending on which ones you have activated.
Enter at the close of that candle (or at the open of the next one if you are conservative).
Automatic Stop Loss → the blue (long) or yellow (short) line that represents the ATR x2.
Take Profit → you decide, but the indicator already gives you the visual reference for the risk (ATR x2), so 1:2 or 1:3 is usually very convenient.
Practical example: You see a large green label “HH LONG V1” → you go long at the close of that candle. Stop right at the blue line (ATR x2 below the price).
Typical target: 2x or 3x the risk (very common to reach it in a trend).
Recommended use: Most traders leave only V1 activated → fewer signals but very high quality.
Those who trade intraday or crypto usually combine V1 + V2.
V3 only for news events or very volatile openings.
In summary:
Label = immediate entry
Blue/yellow line = automatic stop
And enjoy the move.


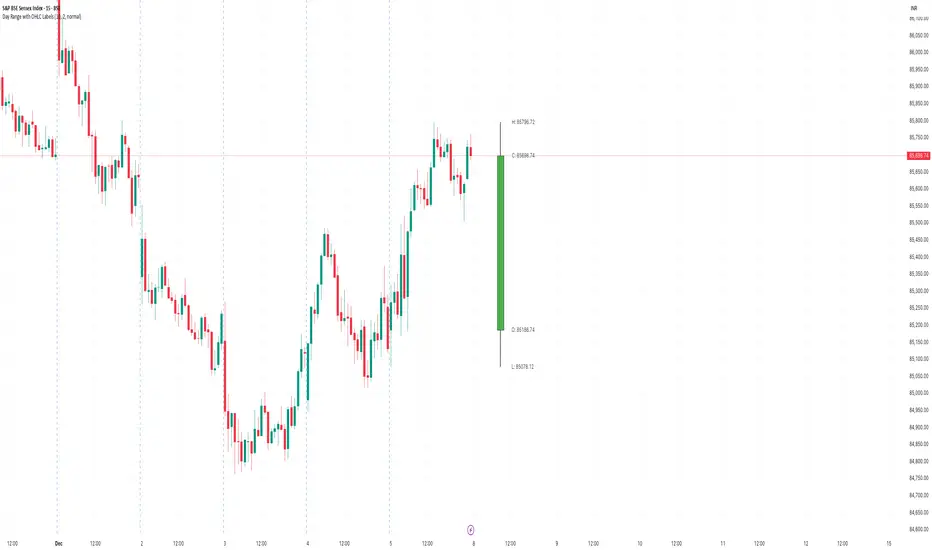
Day Range with OHLC LabelsThis indicator creates a synthetic daily candlestick that appears to the right of the chart, visually separated from real price bars.
It helps traders quickly view each day’s High, Low, Open, and Close without zooming, scrolling, or switching to higher timeframes.
What This Tool Does
✔ Draws a floating daily candle to the right of the current chart
✔ Displays the true Daily Open, High, Low, and Close
✔ Shows a center-aligned wick representing the full high-low range
✔ Shows a box-style candle body positioned using real OHLC values
✔ Labels the values (O, H, L, C) with large, clear fonts
✔ Automatically updates at each new day
✔ Works on any timeframe
✔ Helps intraday traders track daily structure visually
Why This Indicator Is Useful
This script is ideal for intraday traders who want instant awareness of the current day’s range.
Instead of guessing or drawing manual lines, you get a clean daily candlestick rendered off to the right side, avoiding chart clutter.
Great for:
Range traders
Breakout traders
Liquidity zone analysis
High/Low reference tracking
Traders who prefer non-intrusive visuals
Customization
Adjustable offset: position the candle further right
Configurable colors for wick + body
Large-font labels for easy reading
Automatically clears and redraws cleanly each day
Summary
This tool creates a clear, minimalistic, right-side daily candlestick complete with OHLC labels and centralized wick.
It’s designed to improve chart clarity and support quick decision-making without blocking price candles.
ZY Target TerminatorThe indicator follows trends and generates short and long signals. Furthermore, when it generates a signal, it displays the maximum profit margins for the last three signals it generated in the same direction. It also clearly indicates the number of candles for which no signal has been generated for the pair. Avoid trading pairs whose profit margins do not align with your trading strategy.

Multi-Timeframe QuartilesThis indicator helps you identify the position of price in comparison with distance to key reference levels on multiple timeframes. Statistically, when the price is opening in the lower quartile of a timeframe, there is a higher chance for that previous low to be taken, depending on the market structure already formed

NEXFEL – Quantum Adaptive MACD System v2.0# NEXFEL – Quantum Adaptive MACD System v2.0
## 📌 Overview
The **NEXFEL – Quantum Adaptive MACD System v2.0** is an advanced, fully integrated decision-support tool built upon an enhanced adaptive MACD engine.
Unlike traditional MACD implementations that rely on fixed parameters, this system uses **R² correlation** to dynamically adjust sensitivity based on current market behavior.
This indicator **does not simply merge tools**; it unifies:
- Adaptive MACD calculation
- Multi-timeframe sentiment (1H + 4H)
- Market regime detection
- Volume confirmation
- Confidence scoring (0–100%)
- ATR stop-loss visualization
- Session filtering
- Daily trade limit control
into a **single coherent trading framework**.
This publication replaces my previous “Adaptive MACD Flow PRO”, as this version is a complete rewrite with new logic, improved structure, and expanded analytical capabilities.
---
## ⚙️ How It Works
### **1. Adaptive MACD Core (R²-Based)**
The MACD sensitivity is adjusted using R² correlation:
- High R² → smoother & more stable response
- Low R² → more reactive & faster response
This adaptation allows the oscillator to naturally adjust to different volatility environments.
---
### **2. Multi-Timeframe Sentiment**
The system analyzes:
- **1H EMAs (10/30)**
- **4H EMAs (20/50)**
A directional sentiment score is generated, allowing signals only when the local timeframe aligns with the higher timeframe structure.
---
### **3. Market Regime Detection**
The indicator identifies whether the market is:
- **TRENDING**
- **RANGING**
- **NEUTRAL**
Signals are validated or filtered depending on the active regime.
---
### **4. Confidence Scoring System (0–100%)**
The signal quality is measured by weighting:
- Momentum
- Volume confirmation
- Market regime compatibility
- Multi-timeframe alignment
- Local trend direction
- Short-term momentum
Only **high-confidence** conditions produce the safest BUY/SELL signals.
---
### **5. ATR Stop-Loss Visualization**
Dynamic stop levels are displayed using:
- ATR × multiplier
A visual reference for risk management without executing trades.
---
### **6. Daily Trade Limit Control**
To prevent overtrading, the system tracks daily signals and restricts new ones once a limit is reached.
---
### **7. Multi-Language Interface**
The panel can display:
- **English**
- **Portuguese**
depending on user selection.
(TradingView requires English as the primary language, which is why it appears first in this description.)
---
## 👤 Who This Script Is For
- Traders seeking a more reliable and adaptive MACD
- Scalpers who prefer high-confirmation entries
- Swing traders analyzing market regimes
- Users needing a clean, objective analytical panel
---
## ⚠️ Important
This indicator does **not** execute trades and does not guarantee results.
It is a **decision-support system**, not a trading bot.
# 📝 Author’s Notes
This version is a complete redesign of my previous indicator.
All components were rebuilt, expanded, and optimized to offer a more structured and reliable trading system.
