Weekly Opening Gap (cryptonnnite)In the context of general equities, opening price that is substantially higher or lower than the previous day's closing price, usually because of some extraordinarily positive or negative news. Opening gap using as a potential target which market usually trades to.
Mum Analizi

ATR PivotsThe "ATR Pivots" script is a technical analysis tool designed to help traders identify key levels of support and resistance on a chart. The indicator uses various metrics such as the Average True Range (ATR), Daily True Range ( DTR ), Daily True Range Percentage (DTR%), Average Daily Range (ADR), Previous Day High ( PDH ), and Previous Day Low ( PDL ) to provide a comprehensive picture of the volatility and movement of a security. The script also includes an EMA cloud and 200 EMA for trend identification and a 1-minute ATR scalping strategy for traders to make informed trading decisions.
ATR Detail:-
The ATR is a measure of the volatility of a security over a given period of time. It is calculated by taking the average of the true range (the difference between the high and low of a security) over a set number of periods. The user can input the number of periods (ATR length) to be used for the ATR calculation. The script also allows the user to choose whether to use the current close or not for the calculation. The script calculates various levels of support and resistance based on the relationship between the security's range ( high-low ) and the ATR. The levels are calculated by multiplying the ATR by different Fibonacci ratios (0.236, 0.382, 0.5, 0.618, 0.786, 1.000) and then adding or subtracting the result from the previous close. The script plots these levels on the chart, with the -100 level being the most significant level. The user also has an option to choose whether to plot all Fibonacci levels or not.
DTR and DTR% Detail:-
The Daily True Range Percentage (DTR%) is a metric that measures the daily volatility of a security as a percentage of its previous close. It is calculated by dividing the Daily True Range ( DTR ) by the previous close. DTR is the range between the current period's high and low and gives a measure of the volatility of the security on a daily basis. DTR% can be used as an indicator of the percentage of movement of the security on a daily basis. In this script, DTR% is used in combination with other metrics such as the Average True Range (ATR) and Fibonacci ratios to calculate key levels of support and resistance for the security. The idea behind using DTR% is that it can help traders to better understand the daily volatility of the security and make more informed trading decisions.
For example, if a security has a DTR% of 2%, it suggests that the security has a relatively low level of volatility and is less likely to experience significant price movements on a daily basis. On the other hand, if a security has a DTR% of 10%, it suggests that the security has a relatively high level of volatility and is more likely to experience significant price movements on a daily basis.
ADR:-
The script then calculates the ADR (Average Daily Range) which is the average of the daily range of the security, using the formula (Period High - Period Low) / ATR Length. This gives a measure of the average volatility of the security on a daily basis, which can be useful for determining potential levels of support and resistance .
PDH /PDL:-
The script also calculates PDH (Previous Day High) and PDL (Previous Day Low) which are the High and low of the previous day of the security. This gives a measure of the previous day's volatility and movement, which can be useful for determining potential levels of support and resistance .
EMA Cloud and 200 EMA Detail:-
The EMA cloud is a technical analysis tool that helps traders identify the trend of the market by comparing two different exponential moving averages (EMAs) of different lengths. The cloud is created by plotting the fast EMA and the slow EMA on the chart and filling the space between them. The user can input the length of the fast and slow EMA , and the script will calculate and plot these EMAs on the chart. The space between the two EMAs is then filled with a color that represents the trend, with green indicating a bullish trend and red indicating a bearish trend . Additionally, the script also plots a 200 EMA , which is a commonly used long-term trend indicator. When the fast EMA is above the slow EMA and the 200 EMA , it is considered a bullish signal, indicating an uptrend. When the fast EMA is below the slow EMA and the 200 EMA , it is considered a bearish signal, indicating a downtrend. The EMA cloud and 200 EMA can be used together to help traders identify the overall trend of the market and make more informed trading decisions.
1 Minute ATR Scalping Strategy:-
The script also includes a 1-minute ATR scalping strategy that can be used by traders looking for quick profits in the market. The strategy involves using the ATR levels calculated by the script as well as the EMA cloud and 200 EMA to identify potential buy and sell opportunities. For example, if the 1-minute ATR is above 11 in NIFTY and the EMA cloud is bullish , the strategy suggests buying the security. Similarly, if the 1-minute ATR is above 30 in BANKNIFTY and the EMA cloud is bullish , the strategy suggests buying the security.
Inside Candle:-
The Inside Candle is a price action pattern that occurs when the current candle's high and low are entirely within the range of the previous candle's high and low. This pattern indicates indecision or consolidation in the market and can be a potential sign of a trend reversal. When used in the 15-minute chart, traders can look for Inside Candle patterns that occur at key levels of support or resistance. If the Inside Candle pattern occurs at a key level and the price subsequently breaks out of the range of the Inside Candle, it can be a signal to enter a trade in the direction of the breakout. Traders can also use the Inside Candle pattern to trade in a tight range, or to reduce their exposure to a current trend.
Risk Management:-
As with any trading strategy, it is important to practice proper risk management when using the ATR Pivots script and the 1-minute ATR scalping strategy. This may include setting stop-loss orders, using appropriate position sizing, and diversifying your portfolio. It is also important to note that past performance is not indicative of future results and that the script and strategy provided are for educational purposes only.
In conclusion, the "ATR Pivots" script is a powerful tool that can help traders identify key levels of support and resistance , as well as trend direction. The additional metrics such as DTR , DTR%, ADR, PDH , and PDL provide a more comprehensive picture of the volatility and movement of the security, making it easier for traders to make better trading decisions. The inclusion of the EMA cloud and 200 EMA for trend identification, and the 1-minute ATR scalping strategy for quick profits can further enhance a trader's decision-making process. However, it is important to practice proper risk management and understand that past performance is not indicative of future results.
Special thanks to satymahajan for the idea of clubbing Average True Range with Fibonacci levels.

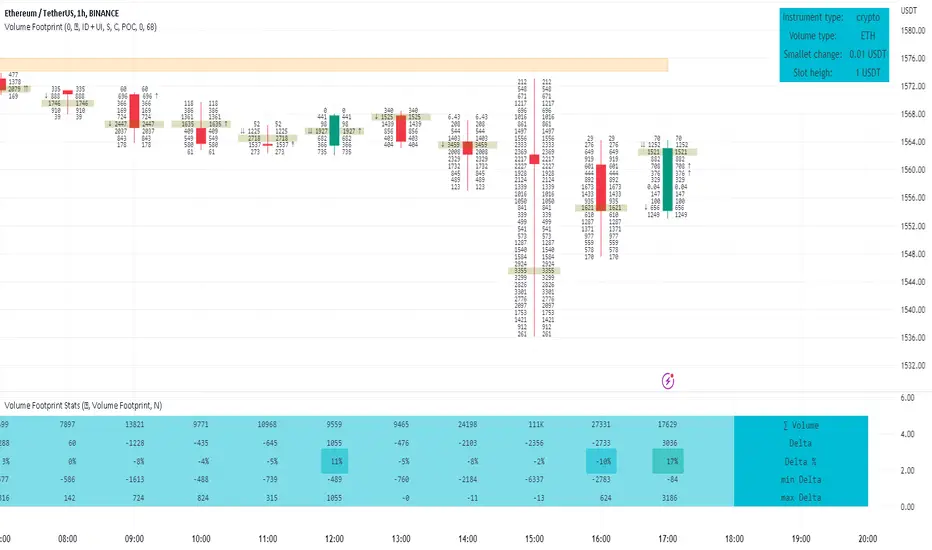
Volume FootprintThe Volume Footprint chart is analyzing volume data from inside the candle and split them into Up and Down Volume in the same way as Volume Profile analyzes the volume data from a fragment of the chart.
The visualization is little different:
Down Volume (sells) are shown on the left side of a candle.
Up Volume (Buys) are shown on the right side of a candle.
User can pick data precision used by Volume Footprint. We recomend to use the highest possible precision.
Unfortunatelly Trading View has many limitations.
If after adding script nothing is visible with error: "'The study references too many candles in history'" you need to use lower precision - It can be changed in script settings.
This script is a part of a toolkit called "Volume Footprint", containing few tools:
Volume Footprint - Scripts drawing Volume Footprint chart.
Volume Footprint Statistics - Script showing table with basic statistics about Up and Down volume inside the candles.
Volume Delta In Candle - Chart showing history of delta (difference between Up and Down volume) changes inside the current candle.
Volume Cumulative Delta - Chart showing history of cumulative delta (sum of difference between Up and Down volume in trading period equal to chart interval).
This script can be used by any user. You do not need to have PRO or PREMIUM account to use it.
Script with limited access, contact author to get authorization
User Interface:
Script is grouping Up and Down Volume into slots based on price. Slots height is controled by "Slot height" param in settings.
On left side of a candle Down Volume is shown and on right side Up Volume is shown.
Before Down Volume may appear imbalance symbols:
⠀↓ - 3 times
⠀↡ - 5 times
⠀⇊ - 10 times
After Up Volume may appear imbalance symbols:
⠀↑ - 3 time
⠀↟ - 5 times
⠀⇈ - 10 times
Above the candle we can show some basic statistics of that candle:
"V:" - Row with volume statistics:
⠀∑ - Total volume,
⠀Δ - Difference between Up and Down Volume.
⠀min Δ - Smallest difference between Up and Down Volume in that candle
⠀max Δ - Biggest difference between Up and Down Volume in that candle
Script settings:
Slot height = 10^ - Price slot height on the chart:
⠀ 0 - 1$
⠀ 1 - 10$
⠀ 2 - 100$
⠀ 3 - 1000$
⠀-1 - 0.1$
⠀-2 - 0.01$
⠀-3 - 0.001$
Data precision - One of 6 levels of data precision: ▉▇▆▅▃▁, where ▉ means the highest precision and ▁ the lowest available precision. On 15 minute chart highest precision should be available, but on 1D it will probably hit TradingView limitations and script will not be even launched by the platform with error: "'The study references too many candles in history'". The general recommendation is to use the highest available precision for a given instrument and interval.
Precise warnings - Option to show precise warnings about missing volume in candle footprint (warning connected with one of TradingView limitations).
Draw candles - Option of drawing candles fiting to volume labels and 2 fields for picking colors of up and down candles. The general recommendation is to hide chart candles and turn on this option.
Show stats - Showing stats over the candle: ∑, Δ, min Δ, max Δ. You can use 'Volume Footprint Statistics' script instead
Font size - Used to draw all the data over the chart: T(iny), S(mall), N(ormal), L(arge)
Centered - If checked volume labels are stick to candle (centered).
Color values - Option to draw labels with use of Up or Down color, depending which value (Volume Up or Volume Down) is bigger in the price slot.
Filter - Filtering option than allow hinding labels with small values:
⠀0 - filter turned off.
⠀1-5 - filtering with transparency
⠀6-10 - Filtering with hiding values.
Show zeros - It can show zeros or leave empty places
Highlight biggest slot - Option to highlight price slot with biggest volume in the candle.
Imbalances - Showing imbalance symbols before Down or after Up Volume
Only over average - Showing imbalances symbols only for volume not smaller than the average value.
Value area - Option to identify group of slots with biggest volume in each candle. A group is a smallest set of neighboring slots that have at least n(param) % of candle volume .
⠀ Value Area Minimal Volume (%) - Value area size as % of candle volume .
⠀ Color - Color of the Value area.
⠀ Show borders - Showing border lines of value areas over the candle.
⠀ Track - Option to track value areas. Potencial Support-Resistance zones.
⠀ Only active - Hide areas that were crossed by the price.
Show Values - Show volume value over tracked value areas.
Troubleshooting:
In case of any problems, send error details to the author of the script.
Known issues:
"The study references too many candles in history" - Change "Data precision" settings to some lower value.
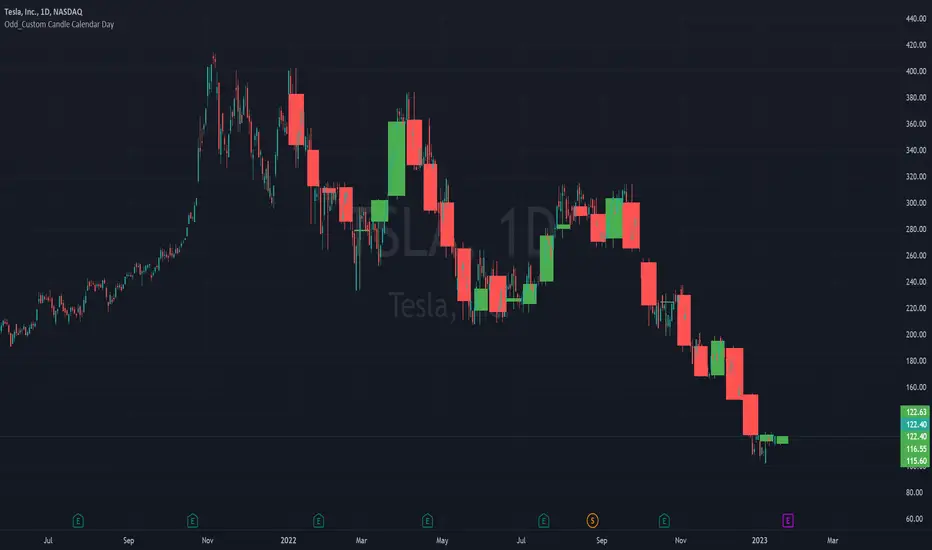
Odd_Custom Candle Calendar DayEver wonder how candles would look on a chart if they were tracked by calendar day instead of market days?
Option(s)-
📅Custom start date for candle formation
✖️Candle multiplier
🌈Up / Down Colors
Features-
📋Displays candle data with invisible plots
Use Move to Existing Pane to Overlay on chart.
Can only display a max of 500 candles!
FOREX MASTER PATTERN Companion ToolWhat This Indicator Does
The Forex Master Pattern uses candlesticks, which provide more information than line, OHLC or area charts. For this reason, candlestick patterns are a useful tool for gauging price movements on all time frames. While there are many candlestick patterns, there is one which is particularly useful...
The Engulfing Pattern
An engulfing pattern provides an excellent trading opportunity because it can be easily spotted and the price action indicates a strong and immediate change in direction. In a downtrend, an up candle real body will completely engulf the prior down candle real body (bullish engulfing). In an uptrend a down candle real body will completely engulf the prior up candle real body (bearish engulfing).
Used in conjunction with the FOREX Master Pattern value line, the Engulfing Pattern can assist the trader with reversal timing or trend confirmation during the expansion and trend phases.
As shown in the screenshot below. Engulfing Candles usually precede a sharp move in price in the direction of the engulfing candle.
As shown in the screenshot below, when the Show Lines option is ON while using the indicator, both red and green lines are drawn on the chart automatically when engulfing candles form. These lines are projected forward 100 bars and tend to be reliable support and resistance areas. These areas are typically hidden from view.
In addition to the Show Lines option, the indicator (by default) creates boxes around trading zones that are created when an engulfing candle is formed. (There is an option to hide these from view if desired).
As seen in the screenshot below, these areas / zones are wider than a line and encompass a resistance / support zone rather than a specific price. Liquidity is usually high in these areas and a lot of selling / buying occurs here. These zones are drawn in advance out into the future giving the trader an idea of where price will revert to eventually.
A combination of LINES and AREAS can be used giving the user a better idea of where within the zone price will go.
As seen on the screenshot below, this combination provides a pretty accurate indication of the reversal point well in advance.
As seen in the screenshot below, when a ZONE / AREA has been fully breached (crossed) by price, the area is deactivated an no longer continues forward on the chart. Until price breaches an area, it remains valid and continues on the chart until and only if it is breached by price.
The Indicator is fully customizable.
The use can change the color of the engulfing candles, the color of the zones, transparency etc. You can turn OFF or ON any of the features such as lines, zones, bar coloring, and plotted arrows.
I really hope you get value from this indicator and... HAPPY TRADING!!

Simple STRAT Tool by nnamWhat this Indicator Does
This indicator is a very simple tool created specifically for experienced Straters. It was created for those Straters who fully understand the 1-2-3 Strat Scenarios, are in need of an easy to use tool, and do not want or need a lot of messy markings on their chart.
The indicator simply allows the user to color code the Strat 1, 2 ,3 (Inside /Outside /Up / Down) Bars as desired and by default extends lines to the right of the chart from the Highs and Lows of the previous 2 Bars giving the user a simple reference for Strat scenario structure breaks.
As shown above, the bars are color coded, but the original bar color is maintained via the border and wick.
If a bar is an Outside Bar or an Inside Bar, it is still easy to identify whether or not the bar was a Bullish or Bearish 1 or 3.
The same goes for 2UP and 2Down Bars - It is easy to identify Bullish or Bearish UP or DOWN Bars.
Optionally, as show in the screenshot below, the user can extend the lines in both directions to get an "at a glance" better understanding of where price is currently vs previous support and resistance areas.
For Straters that prefer to trade only INSIDE BAR BREAKOUTS there is an optional input setting labeled "Trade Inside Bars ONLY".
This setting turns OFF the lines that extend from the 2nd previous bar back and only displays and extend lines from the previous bar IF and ONLY IF the current bar is an INSIDE (one) bar. .
The User Input settings allow for the following customizations:
1. Custom Outside Bar Color
2. Custom Inside Bar Color
3. Custom 2 Up Bar Color
4. Custom 2 Down Bar Color
5. Turn ON or OFF color coded bars
6. Trade only INSIDE Bar Breakouts
7. Extend Lines Both Directions
8. Hide all Lines
The customizable settings above allow the user to hide all lines and turn OFF color coding without having to fully remove the indicator from the chart. This is convenient when the user has another indicator that uses color coded bars or the lines conflict with another indicator and they need to be temporarily disabled.
If you have any questions regarding this indicator please let me know. If you have any suggestions for minor tweaks to the indicator do not hesitate to ask for them.
I hope you enjoy this indicator and get some usefulness from it... HAPPY TRADING!!
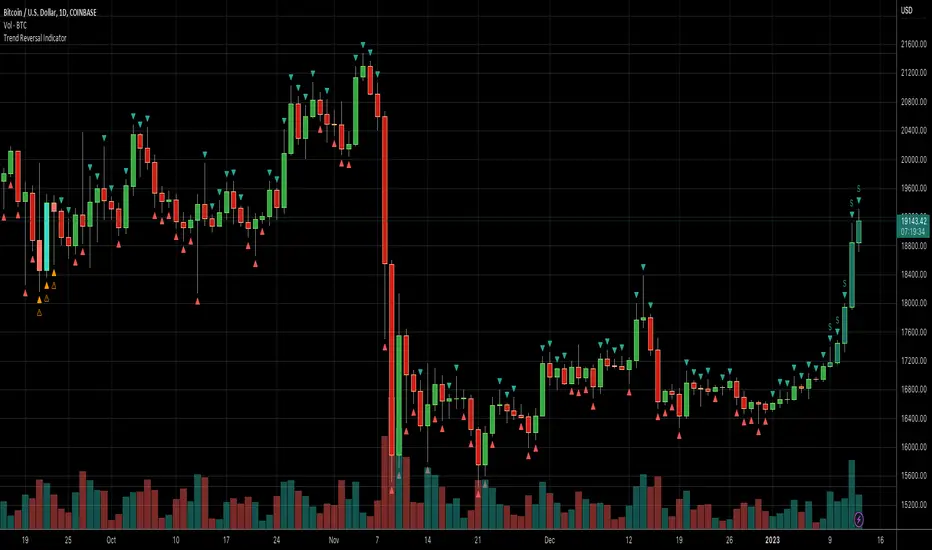
Daily Number/Trend Reversal IndicatorIndicator identifies potential price trend exhaustion.
Compares this period against the 4th prior period for the condition.
9 periods (or more) with the same condition is an indicator that the trend is ending soon.
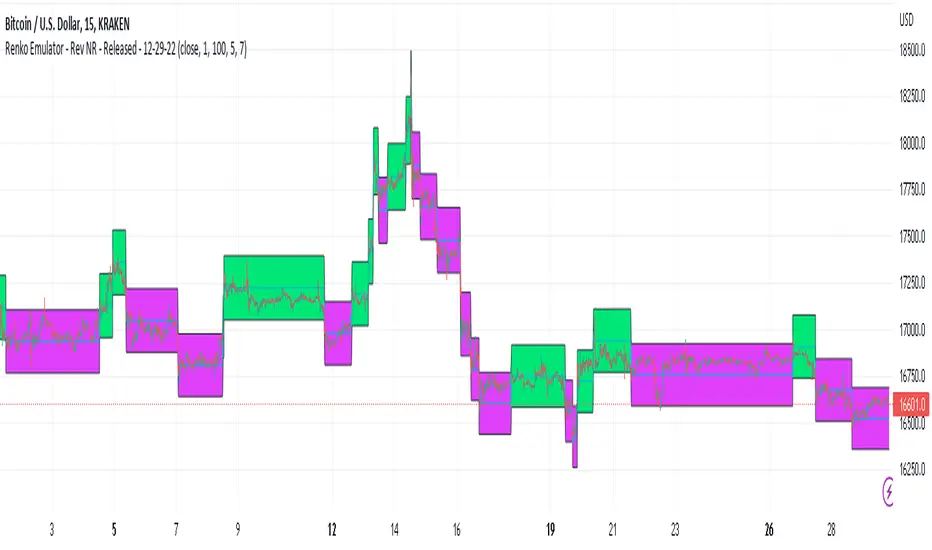
Renko Emulator - Rev NR - Released - 12-29-22Renko Emulator - Rev NR - Released 12-29-22
By Hockeydude84
Simple script to Emulate Renko Charting behavior on standard candle stick charts. Code provide capability to select between standard(ish) Renko bricks (in this code it's defined by percent vs ticks/value), or an ATR brick option. For ATR bricks, the code provides an option to inhibit emulator movement (formation of new bricks) by providing a minimum threshold that must be present. This threshold is the "Standard Brick" input (the input pulls double duty). Code also provides multiple plotting options.
Use the code to help see trends and reduce the chop/erroneous data. Also helps to identify where trend deviations are present.
OHLC ToolOHLC Tool allows you to display Current or Historical OHLC Values as horizontal lines that extend to the right on your chart.
Features
Variable Lookback to display a specific historical bar's values. Default = 1 (Previous Candle)
Customizable Timeframe to view HTF Candle values.
Custom Line Colors, Styles, and Thicknesses.
Price Scale Value Display Capability.
For displaying the line values and labels on the price scale you will need to enable:
"Indicator and financials name labels"
and
"Indicator and financials value labels"
These options are found in the Price Scale Menu under Labels. Price Scale Menu > Labels
When you do this you will notice your other indicator values will also be on the price scale,
if you wish to disable these, go to the indicator settings under the "Style" Tab, Uncheck the "Labels on price scale" box.
Indicator Settings > Style > "Labels on price scale"
Enjoy!

Gaps (modified TradingView standard indicator)Based on standard TradingView "Gaps" indicator, but modified so that the gaps are displayed until fully closed (not jus paritally like the original indicator).

Reversal BarsReversals, both upward and downward, show where major market participants believe a stock has gone too far and can often mark a change in trend.
Upside Reversal:
Current bar undercuts previous bar
Price closes in the upper 60% of the range
Downside Reversal:
Current bar makes a high above previous bar
Price closes in the lower 60% of the range
This indicator will plot a label below an upside reversal and above a downside reversal that shows the closing range of the bar.

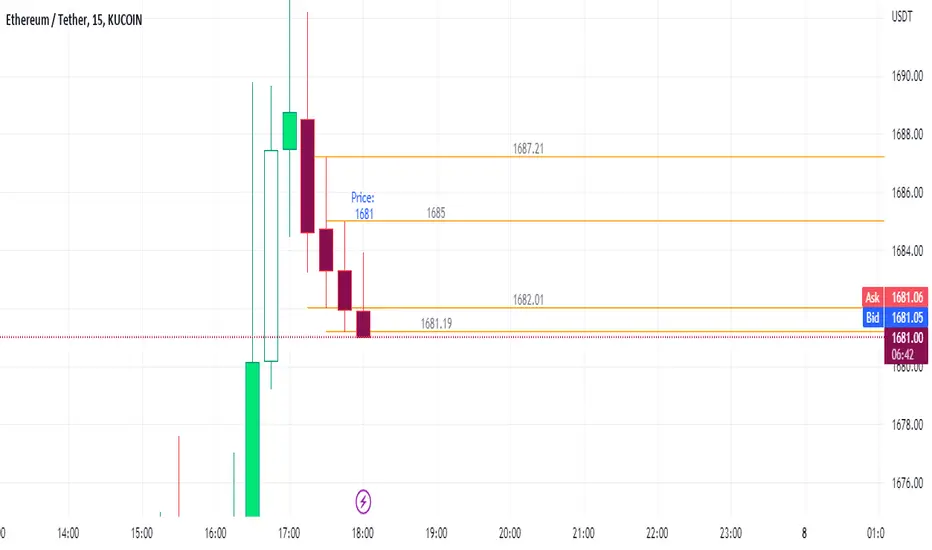
Order Flow RegisterOrder flow register is a tool showing history of transactions done recently. It analyze volume and price data to estimate how many "bid" and "ask" transaction was done on the market.
Typically bid transactions are done by active sellers (with passive buyers) and ask by active buyers (with passive sellers).
The advantage of ask transactions shows the emotions of buyers who are willing to pay more to buy.
The advantage of bid transactions shows the emotions of sellers who are willing to sell cheaper to exit the position.
This tool requires frequently updated real-time data to function efficiently.
Warning !
TradingView has a data delay feature on many exchanges (10-30 minutes) and real-time data are extra paid in that case. Missing real-time data source will limit the functionality of the script to educational purposes only.
User Interface:
In the table placed in the right-top corner you can find transaction data in 3 columns. First with bid transaction volume, second with price and third with ask transaction volume.
Value shown between "Ask" and "Bid" labels is showing price change done with last transaction (usefull when agregate option is on).
If agregate option is on:
- Addition row with last registered transaction is shown over labels(row with "Big" and "Ask" label).
- Price label of active row (first below the labels) has changing background color linearly between ask and bid value depending in which part of agregated price slot current price is.
Script settings:
Agregate - Option to agregate transactions into areas of some height
FieldHeight = 10^ - Area height on the chart:
0 - 1$
1 = 10$
2 = 100$
3 = 1000$
-1 = 0.1$
-2 = 0.01$
-3 = 0.001$
Troubleshooting:
In case of any problems, please send error details to the author of the script.

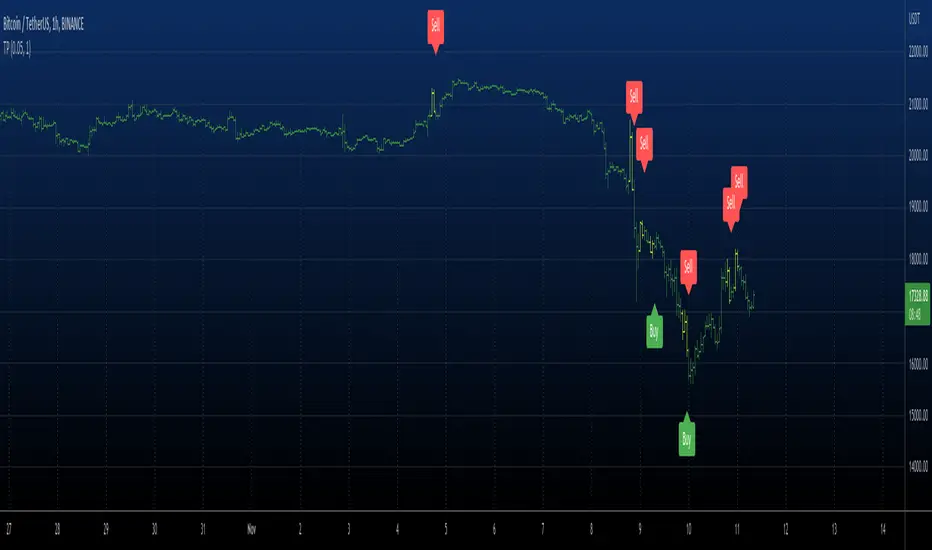
1 Minute Scalping IndicatorThis is a 1 Minute Scalping Indicator based purely on price action of the current candle compared to the previous candle so there is no lag from using other indicators. It works great on all timeframes, but is designed for getting in and out of positions quickly using the 1 minute chart. The candles will paint according to the direction the price is currently moving in, which is a great way to help reduce anxiety while watching the candles bounce back and forth.
HOW TO USE
It has Scalp Mode and Swing Mode. Both modes use the exact same price action parameters for signals, but Swing Mode will only give signals when the price action parameters are met AND the close is higher than the previous high for bull signals or when the close is lower than the previous low for bear signals.
This scalping indicator will show green up arrows when it detects bullish price action and red down arrows when it detects bearish price action. It will show a yellow arrow if the bullish/bearish price action conditions are met, but it detects a candle pattern that may be a weak signal such as small candle body, large wicks, etc. When this happens, make sure to wait for the next candle to show confirming price action before following the signal. You can also turn the signals off and use only the candle coloring if you prefer cleaner charts.
You can change the candle colors it uses within the input settings, as well as the color of the signal arrows to suit your preferences. You can also turn off the candle coloring if you prefer normal candles. If you are using the indicator’s candle coloring, make sure you go to your chart settings(gear icon top right) and in the symbol tab, turn off body, borders and wick for this to show up properly.
This scalper also includes alerts for bull and bear signals that can be set to alert you on any market and timeframe.
SCANNER
We also made a higher timeframe scanner that uses this same price action formula and shows you if higher timeframes are currently bullish or bearish in real time. It’s titled Higher Timeframe Price Action Scanner and can be found on our profile. I strongly recommend using both of these together to get an idea of the overall trend on longer timeframes. You can also use two of the scanners and set them to two tickers that move together or opposite of each other(like SQQQ and TQQQ) for even more market insight on your ticker's immediate direction.
MARKETS
This 1 Minute Scalping Indicator works well on any market such as stocks, crypto, forex, futures, etc.
TIMEFRAMES
This indicator is designed for scalping on the 1 Minute timeframe, but it works well on all timeframes, since it is using price action to give signals.
TIPS FOR BEST RESULTS
We recommend pairing this indicator with another support & resistance or moving average combo to find great entry areas and use the price action signals as confirmation when price bounces off of those areas. We also recommend using the Higher Timeframe Price Action Scanner with this so you can see the overall trend of higher timeframes on your chart and trade in the direction of the trend.
Scalp Mode
Swing Mode
Candle Coloring Only - No Signals - Scalp Mode
Candle Coloring Only - No Signals - Swing Mode

Real Price Line + Dots (for Heikin Ashi)Real Price Line + Dots (for Heikin Ashi)
This indicator is designed for use on Heikin Ashi charts. Its purpose is to enable traders to benefit from price averaging and smoothing effects of Heikin Ashi candles whilst also enabling them to see the current real price line, and optionally, real price close dots on the Heikin Ashi candlesticks.
Features include:
- Optional real price line
- Optional real price close dots
- Customisable colours
- Customisable line style
- Customisable line width
What are Heikin Ashi candles?
Heikin Ashi means 'average bar' in Japanese, Heikin Ashi charts do not show real price as standard, due to the way the Open, High, Low and Close values are calculated using averages, This is done in order to create a smoother appearance and reduce the market 'noise'.
You can read more about Heikin Ashi candlesticks here.
NOTE:
- If real price dots appear behind the candles, you may need to select the triple dot menu on the indicator then select "Visual order" > "Bring to front" , so that the dots are shown above the candles.
- When using this indicator on a Heikin Ashi chart, the standard Tradingview price line will not show accurate real price. Therefore when using the price line in this indicator, the standard price line should be disabled within the Tradingview 'Chart settings' dialog > 'Symbol' tab > uncheck 'Last', under the 'Price line' section.

Rate of Change Candle Standardized (ROCCS)ROCCS is a standardized rate of change oscillator with "error bars". Rate of change helps traders gauge momentum in a market by comparing the current price with the price "n" periods ago. What makes this special is you get to see the momentum of the momentum via the candle view. The candle transformation utilizes a moving average to smooth the signal however this is only used for the close price. The high and low prices are not smoothed. The moving average has an adjustable period, and so does the standardization.
I hope you can find great use in this upgraded roc indicator.

Mark Structure ShdwMark Structure Show is building the market swing structure, minor and sub structure and marks all possible insignificant pivots
This indicator is the alternative version of Mark Structure indicator, I had to create another indicator in order to avoid programming limitation of TreadingView.
This version uses confirmation approach as confirming by body, it means every swing low/high is confirmed when the body (of newly creating swing low/high correspondingly) takes place and intercepts it. the same behaviour is with breaking structure its confirmed only by body.
From trading prospective with this kind of approach we can easily detect manipulations (caused by sweeps) and disregard those manipulation as elements which are breaking the structure. so its extremely useful for those who are trading smart money price actions and basing on swing structure POI
it supports:
- Marking all pivots with labels or join them continuously with trend lines.
- Marking minor and sub structured swings with labels or join them continuously with trend lines. Marking last actual CHoCH and BOS. Minor and substructure are structures inside swing structure and it can differ from the structure of lower timeframe
- Marking swings of swing structure with labels or join them continuously with trend lines.
- Changing bullish and bearish colors of each kind of structures
- Changing pivot labelings
- Changing colors
Remarks:
- Don't expect to have minor and sub structure in each swing waves, its totally fine when you don't have them at all
- Swing structure is the most significant structure and shows real price direction.
- The last swing is not able to be confirmed it tries to build 2 swings that most likely would be either substructure or SMS BOS

The Fearless Power Suite systemDear TradingView community and followers,
Through my years I have often seen trading systems with many functionalities or indicators that can be customized in numerous ways; however I wanted something that could stomach most trading contexts without having to change settings while allowing me to have the freedom of a clean chart to keep using discretionary trading as confluence.
Using a complex combination of bullish/bearish technical breakouts (looking at general market structure while combining candlestick patterns, exponential moving averages and various indicators that indicate new trends), the aim of this system is to catch safe breakouts and at the same time notify the user of fake outs and unfavorable market conditions.
Settings to be used:
The following settings are to be used; the Fearless Power Suite system (FPS) is based on candlestick closes to correctly identify market conditions and patterns. It is not recommended to change them because waiting for candlestick closes in my opinion adds extra “confirmation” for decision taking.
Len: 14
Source_input: Close
Start: 0.02
Increment: 0.02
Max value: 0.2
How to use the system:
General context: Bias formation for directional trading is formed by looking at the general market structure which in this case is primarily created by looking at the cloud formed by the 2 moving averages. “The cloud” is referred as the space within the 2 moving averages.
One of the lines is the 21 EMA (which is my favorite classical EMA) and a “Super MA” formed by a simple mathematical equation. This allows the trader to always keep an eye on key support and resistance levels and optimize entries by entering at these given levels. The 21 EMA is a must in my opinion to enter bounces within a trend or very aggressive entries while the “Super MA” is rather to find extreme points for market reversals.
Top and bottom warning: Indicators signaling potential bottoms or tops already exist but the warning often comes only after a certain breakdown/breakup already happening but rarely on the candlestick itself.
Example: To give you a bearish signal, indicators often give you a signal on an engulfing red candlestick that follows a smaller green candlestick because it shows weakness, but rarely do you see this warning made on the green candlestick itself! Of course, it’s a signal given with less confirmation but to take partial profit on your trades it is quite effective.
Market structure breakout signals: Taking into account the general structure of the market (trending/ranging) as a result of using volatility and volume as key indicators of this complicated mix, trade signals are often given when it is considered “safe” to enter. The beauty of this, which is decently rare from what I’ve seen, is that during choppy conditions (which are not recommended to be traded) the trader will get fewer signals than usually. This is doable thanks to the volume and volatility monitoring.
The aim of these structure breakout signals is to reduce market noise and only highlight key moments of the market when you should pay attention. The candlestick formations which will create these signals will always have a certain importance from a market structure perspective and so a SL can easily be found at all times when entering during that time.
No trade zones: As previously mentioned one of the features of this system is to notify the trader in case of bad context. 2 different signals might come up “No long” or “No short” which means that from a statistical perspective it is highly recommended not to take a long or short entry in that given signal to avoid disastrous trades.
The “No long”/”No short” function of the system primarily uses Daily Range data which will continue to change during the day until the daily close, information such as Daily Low and Daily High will thus evolve. This means that sometimes this part of the FPS system will repaint but it’s not a common occurrence. This function is mainly used to reduce your current risk in case you are in a trade or to not enter any position, but not a signal for entry on its own.
Concepts combination:
This system will give you a decent amount of trade opportunities, I strongly advice you nevertheless to always find confluence in your decision making with discretionary trading as well if possible. Patience is key as always. Here is a small list of trade combinations to be used to improve results.
Example 1: Entering a position when getting a market breakout signal given after seeing a top or bottom warning on your chart. This is what we could call a “double confirmation”.
Example 2: Using the “Super MA” considered as extreme value for market reversals in a certain timeframe (15minutes for this example) while also looking at the above timeframe (1 hour in this example) for the 21EMA to be situated at the same level for a trending bounce and thus again getting a double confirmation. (Because both timeframes expected a reaction from that level). Seek a market structure breakout signal on the 15 minutes to get even more confirmation and a pre-made Stop Loss.
Limitations:
Although the signals are all created following a strict amount of technical rules not all should be taken. It is the trader’s duty to always find confluence to improve long term results. This is not a “magical bot”; I firmly believe that the best combination in trading comes from new technologies and using human intelligence.
When the Fearless Power Suite system (FPS) is used on a chart where volume data is not available not all functions will be available as volume data is taken into serious consideration for entries and trend following signals. General market structure and part of the FPS system will still be available nonetheless.
PS: The FPS works for every market and every timeframe, I personally mainly use it on cryptocurrencies (and on the SP500 and DXY for added confirmation to get a general grasp of market context).
I hope this description was useful enough :)

Tweezer PatternsTweezer top and bottom, also known as tweezers, are reversal candlestick patterns
that signal a potential change in the price direction. Both formations consist of
two candles that occur at the end of a trend, which is in its dying stages.
The tweezer bottom candlestick pattern is a bullish reversal pattern that can be
spotted at the bottom of a downtrend. It consists of two candles, where the first
candle is in line with the bearish trend, while the second candle reflects more
bullish market sentiment as the price bursts higher, in the opposite trend.
The tweezer top candlestick pattern is of the same structure as the tweezer bottom,
except for the fact that it happens at the end of an uptrend, and therefore, it is a
bearish reversal pattern. The first candle is bullish, and it continues in the same
direction, while the second bearish candle indicates that the trend may be changing soon.
Both the bottom and top tweezers are only valid when they occur during uptrends and downtrends.
Their appearance during choppy trading conditions is practically meaningless, and it signals
the market indecision to move in either direction.
WARNING:
- For purpose educate only
- This script to change bars colors.
Largest Candle Profile - Selection ToolLargest Candle Profile
A simple script that finds the largest candle between a user's defined area. Search for the largest candle (high-low), largest body (open-close) or largest wick between any selected area.
How To Use:
Anchor pivot A and B on the area of choice.
Indicator can be used to detect levels of interest. Coded to be used with anchored vwap, flexible volume profile or liquidity gaps.
In action:

BE- InsideOut Explosion - Trade the Benefit Of DoubtDear Traders,
Here with presenting the new Indicator which is primarily built based on the the concept Contraction & Explosion.
Idea behind this Indicator: I am sure every trader would have heard about consolidation and Expansion. When we we look deep inside the consolidation zone it leaves a mark
on the direction most of the time and just explode breaking the consolidation zone. What if the explosion is to trap the retailers like me!!. That's why I call this as Benefit of doubt. If the direction of is right I just sail with the trade right inside the consolidation zone. If I am on the wrong side ! No worries My Money management rules and Protection Legs kicks in and saves my capital.
This Indicator Analyses the Volume, and Chart Patterns inside the Zones and if the price breaks the patterns, initiate the trades. You can trade with Dhan HQ or Algoji.
What this indicator is providing:
Based on the chart patterns and using the inputs provided for RISK and Money Management options, Indicator continuously scans for trading opportunities and provides alerts for possible trades. I have tried to capture some analytical inputs for one to think and take control over the Reward, Risk and Money management parameters to tweak the indicator accordingly.
Note: Indicated PNL is calculated on the Futures Chart with 2 Lots taken per trade.
If you are a Options Traders:
1. Auto Strike is inbuilt and can be traded only if you are trading via AlgoJi.
You will constantly be informed about trade summary, PNL and SL updates as per your preferred choice.
Enjoy!
DISCLAIMER: No sharing, copying, reselling, modifying, or any other forms of use are authorized for our documents, script / strategy, and the information published with them. This informational planning script / strategy is strictly for individual use and educational purposes only. This is not financial or investment advice. Investments are always made at your own risk and are based on your personal judgement. I am not responsible for any losses you may incur. Please invest wisely.
Happy to receive suggestions and feedback in order to improve the performance of the indicator better.

Stochastic CandlesIn this indicator I have transformed the %K line into adjustable candles. Because of this I have increased the length of the %D line to be more useful in this context. It is worth noting that you get the same momentum indication as %D set to 4 just because of the default candle transform setting. Incase you need to brush up on how stoch works here is the built in summery.
The Stochastic Oscillator (STOCH) is a range bound momentum oscillator. The Stochastic indicator is designed to display the location of the close compared to the high/low range over a user defined number of periods. Typically, the Stochastic Oscillator is used for three things; Identifying overbought and oversold levels, spotting divergences and also identifying bull and bear set ups or signals.

Hammer & Shooting Star [C] - KaspricciHammer and Shooting Star
This indicator identifies Hammer and Shooting Star candles and marks them with a respective label. It uses a set of predefined fibonacci levels to measure the size of the body in comparison to the overall size of the candle. You can change the fibonacci level according to your preferences.
You can enable a confirmation of the Hammer or Shooting Star candle by a following green or red candle.
Settings
Fibonacci Level - Select on of the predefined fibonacci levels as a threshold for the maximum size of the body compared to the overall size of the candle.
Confirm by next candle - by default turned off. If turned on, this will check the subsequent candle and only mark a Hammer followed by a green candle or a Shooting Star followed by a red candle.
Show labels on chart - by default turned on. If turned off, the indicator will hide the labels on the chart.
Alerts
You can create alerts for Hammer and Shooting Star candles. The indicator provides the respective conditions.
Linking with Backtesting Strategy
I also added a feature to combine this indicator with a backtesting strategy. It provides a plot Connector which can be selected in a backtesting strategy supporting this linking feature.
Signals:
Signal: 2 - Hammer candle (long entry)
Signal: -2 - Shooting Start candle (short entry)
You can see the signal values in the status line of the indicator. This is based on the External Signal Protocol defined by PineCoders .

Pinbar by BirdCoinIt is the most customizable Pinbars indicator that you can find.
The indicator autonomously detects the Pinbars to which filters can be placed. The available adjustments are:
- The spread of the Pinbars
- The wick and the body ratio of the Pinbars
- The volume of the Pinbars
- Number of the previous candles that the Pinbars hunted
Happy trading!
~ Birdcoin
