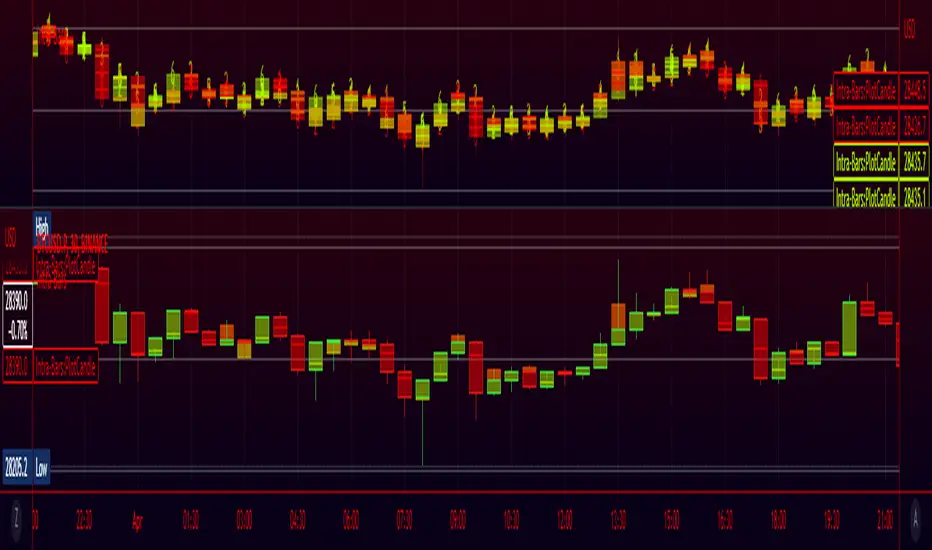
Intra-Candles*For use with <=24 hour Hollow Candles *
Indicator for more informative candle plotting. Select from 2-6 lower timeframe candles and view the price action of the lower bars within the normal chart's candles. Plotting short time frame candles with a semi-transparent body lets you see reversals that occurred during the larger candle's formation. Use the information provided to inform your own trading decisions.
Mum Analizi
Candle Counter [theEccentricTrader]█ OVERVIEW
This indicator counts the number of confirmed candle scenarios on any given candlestick chart and displays the statistics in a table, which can be repositioned and resized at the user's discretion.
█ CONCEPTS
Green and Red Candles
A green candle is one that closes with a high price equal to or above the price it opened.
A red candle is one that closes with a low price that is lower than the price it opened.
Upper Candle Trends
A higher high candle is one that closes with a higher high price than the high price of the preceding candle.
A lower high candle is one that closes with a lower high price than the high price of the preceding candle.
A double-top candle is one that closes with a high price that is equal to the high price of the preceding candle.
Lower Candle Trends
A higher low candle is one that closes with a higher low price than the low price of the preceding candle.
A lower low candle is one that closes with a lower low price than the low price of the preceding candle.
A double-bottom candle is one that closes with a low price that is equal to the low price of the preceding candle.
█ FEATURES
Inputs
Start Date
End Date
Position
Text Size
Show Sample Period
Show Plots
Table
The table is colour coded, consists of three columns and twenty-two rows. Blue cells denote all candle scenarios, green cells denote green candle scenarios and red cells denote red candle scenarios.
The candle scenarios are listed in the first column with their corresponding total counts to the right, in the second column. The last row in column one, row twenty-two, displays the sample period which can be adjusted or hidden via indicator settings.
Rows two and three in the third column of the table display the total green and red candles as percentages of total candles. Rows four to nine in column three, coloured blue, display the corresponding candle scenarios as percentages of total candles. Rows ten to fifteen in column three, coloured green, display the corresponding candle scenarios as percentages of total green candles. And lastly, rows sixteen to twenty-one in column three, coloured red, display the corresponding candle scenarios as percentages of total red candles.
Plots
I have added plots as a visual aid to the various candle scenarios listed in the table. Green up-arrows denote higher high candles when above bar and higher low candles when below bar. Red down-arrows denote lower high candles when above bar and lower low candles when below bar. Similarly, blue diamonds when above bar denote double-top candles and when below bar denote double-bottom candles. These plots can also be hidden via indicator settings.
█ HOW TO USE
This indicator is intended for research purposes and strategy development. I hope it will be useful in helping to gain a better understanding of the underlying dynamics at play on any given market and timeframe. It can, for example, give you an idea of any inherent biases such as a greater proportion of green candles to red. Or a greater proportion of higher low green candles to lower low green candles. Such information can be very useful when conducting top down analysis across multiple timeframes, or considering trailing stop loss methods.
What you do with these statistics and how far you decide to take your research is entirely up to you, the possibilities are endless.
This is just the first and most basic in a series of indicators that can be used to study objective price action scenarios and develop a systematic approach to trading.
█ LIMITATIONS
Some higher timeframe candles on tickers with larger lookbacks such as the DXY, do not actually contain all the open, high, low and close (OHLC) data at the beginning of the chart. Instead, they use the close price for open, high and low prices. So, while we can determine whether the close price is higher or lower than the preceding close price, there is no way of knowing what actually happened intra-bar for these candles. And by default candles that close at the same price as the open price, will be counted as green. You can avoid this problem by utilising the sample period filter.
The green and red candle calculations are based solely on differences between open and close prices, as such I have made no attempt to account for green candles that gap lower and close below the close price of the preceding candle, or red candles that gap higher and close above the close price of the preceding candle. I can only recommend using 24-hour markets, if and where possible, as there are far fewer gaps and, generally, more data to work with. Alternatively, you can replace the scenarios with your own logic to account for the gap anomalies, if you are feeling up to the challenge.
It is also worth noting that the sample size will be limited to your Trading View subscription plan. Premium users get 20,000 candles worth of data, pro+ and pro users get 10,000, and basic users get 5,000. If upgrading is currently not an option, you can always keep a rolling tally of the statistics in an excel spreadsheet or something of the like.

MTF Candle [Pt]The Multi-Timeframe (MTF) Candle Tool is a powerful indicator designed for traders who wish to analyze standard candle bars and Heikin Ashi candles of multiple timeframes simultaneously. This tool is ideal for traders who prefer to trade in higher timeframes while keeping a close eye on the lower timeframes for confirmation signals. The indicator works by overlaying standard candle bars or Heikin Ashi candles of a higher timeframe onto the current chart. This allows traders to quickly switch between the current timeframe and the higher timeframe, without having to switch charts.
Features
- Live, real time updating MTF candle
- Custom colors
- Heikin Ashi candle
- Heikin Ashi Inside bar highlight

Cloud Bunching [5ema]Reused some functions from (i believe made by):
©paaax: The table position function.
@QuantNomad: The function calculated value and array screener for 40+ instruments .
How it uses:
Gives signal when the cloud is bunching with ratio smaller than the set ratio and the close price breaking out the cloud.
Track 40 different symbols, on any timeframe to follow and alert.
When a symbol has a signal, it will display on the chart and send an alert.
How it works:
The cloud created by 5 EMA (20, 50, 200, 460, 610). Upper Cloud is max EMA , Lower Cloud is min EMA . Center line is averange (5 EMA )
If the ratio upper / lower < input bunching (%) -> change color of cloud.
Get the signal if: the close price break out cloud (with bar is shooting, or hammer ,...) and high volume (or not).
With another symbols (max 40 ) also use that function with any time frame. By request.security() and array function.
How it setting:
Change the bunching rate (%) of the clouds for any symbols.
Change the percentage (%) of the close price that breaks out of the bunching cloud.
Choose volume condition.
Show or turn off the cloud, table.
Select the symbol to follow.
Choose a timeframe to follow other symbols.
----
This indicator is for reference only, you need your own method and strategy.
If you have any questions, please let me know in the comments.

Remove Hodler [5ema]How it inputs:
Select the timframe to check.
Input the number of bars lookback (or the number of bars corresponding to the selected timeframe)
Input the percentage of change of the price during that time.
Input the number of shotting bars.
Input the symbols want to follow.
How it works:
Calculate the number of shotting bars on the number bars lookback.
Calculate rate of change (with high, low price).
How it uses:
If the returned result is less than the input values (number shooting bars, the price change percentage). A buy signal will be given.
The same calculation applies to the symbols in the input list to monitor and return the results to the table on the chart and send notifications.
I reused some functions, made by (i believe that):
@everget : The table position function.
©paaax : The RSI divergence function.
@QuantNomad : The function calculated value and array to show on table for input symbols.
I have commented in my code. Thanks so much!
----
This indicator is for reference only, you need your own method and strategy.
If you have any questions, please let me know in the comments.

Break Levels – Peaks and Valleys – Market StructureDescription
An experimental script, designed as a visual aid, to highlight two consecutive green candles after a red candle, and two consecutive red candles after a green candle. We can assume these formations to be potential candidates as an origin of a peak and valley. The highest point of the 1st red candle and lowest point of the 1st green candle is to be considered as break levels.
How to use
Expect attacks/tests or a break of these levels in the future. A solid break through these levels may produce a potential retest in the opposite direction. The greater the number of times a zone is tested, the more likely it is to break.
By using them as reference points, traders are expected to follow their own set of rules and mark higher probability supply and demand zones in the area.
Alerts are added for either a candle close or wick through the levels. For the alerts the script only trails the latest high and low break levels.
This can be used as an alternative to those who use fractals for market structure.
Indicator in use

Buying and Selling Pressure Raw Multi (TG Fork)Visualize raw buying and selling pressure via 3 different calculation methods, all superimposed with dynamic rescaling.
Buying and selling pressure is the concept of quantifying the disproportion between buying and selling. In practice, there is no single definitive way to calculate it.
This indicator is a merge to display three different methods to calculate buying and selling pressure, with automatic visual rescaling to superimpose the three simultaneously, updated to PineScript v5, and with some additional improvements for speed and calculation precisions, and instead of the EMA, other types of moving averages can be used.
I primarily made it for my own needs, but as always, I like sharing with the community, as maybe others may find this useful too.
How to use:
* As often, the goal is to get as many of the 3 signals concur together to get a stronger aggregated signal.
* First signal: If the green bars on the histogram are bigger than the red ones, then there is more buying pressure, and vice versa.
* Second signal: If the background is green, there is more buying pressure, and vice versa if the background is orange. The yellow and green lines define the background color, but they are by default hidden for a less cluttered visual experience.
* Third signal: If the cloud is blue, there is more buying pressure, and the bigger the cloud, the more momentum there is for it to stay (and more difficult it is to reverse to selling pressure). If the cloud is red, there is more selling pressure.
If you like this indicator, please don't give me any credit, instead please show some love to the original authors (in no particular order):
ceyhun:
daytraderph (I could not find the link to the original script, the page is inaccessible?):
www.tradingview.com
fract:

DojiCandle body size RSI-SMMA filter MTF
DojiCandle body size RSI-SMMA filter MTF
Hi. I was inspired by a public script written by @ahmedirshad419, .
I thank him for his idea and hard work.
His script is the combination of RSI and Engulfing Pattern.
//------------------------------------------------------------
I decided to tweak it a bit with Open IA.
I have changed:
1) candle pattern to DojiCandle Pattern;
2) I added the ability for the user to change the size of the candlestick body;
3) Added SMMA 200;
4) Changed the colour of SMMA 200 depending on price direction;
5) Added a change in the colour of candlesticks, depending on the colour of the SMMA 200;
6) Added buy and sell signals with indicator name, ticker and close price;
7) Added ability to use indicator on multi time frame.
How it works
1. when RSI > 70 > SMMA 200 and form the bullish DojiCandle Pattern. It gives sell signal
2. when RSI < 30 < SMMA 200 and form the bearish DojiCandle Pattern. It gives buy signal
settings:
basic setting for RSI, SMMA 200 has been enabled in the script to set the levels accordingly to your trades
Enjoy

Pin Candle DetectionPin candles are a variation of hammer candles that are useful in technical analysis . In particular, when combined with volume profile studies, they can be a powerful set up for long entries or other decision making.
For example, when looking at volume profiles, a long entry would be a fair value area (i.e. 40%) below the close of a pin candle. When combined with a support level , the set up is stronger.
While most scripts look for hammer candles, pin candles are somewhat different in that the length of the wick is significant.
This script and its parameters was built for ES futures 15 min chart in mind.
This script is unique in that it allows for the below parameters to be adjusted to suit other instruments and timeframes:
1. Fib level: Candle must close within a certain retracement level). My preference is 0.55. Some traders like 0.5, while others prefer 0.33
2. Wick length: Pin candles differ from pure hammers in that the length of the wick must be significant. My preference is 7 points on ES (as in $ and not ticks)
Add this script to your alerts to no longer miss these set ups.

Swing Indicator (2 before, 1 after) v2 with Dong-DangFeatures
Detection Swing (swing HIGH is the highest bar among 2 bars before and 1 bar after, and swing LOW is the lowest bar among 2 bars before and 1 bar after)
Dong-Dang (The line plot switch between a swing HIGH and LOW ==> represents the price movement)
Fixes
fix swing detection from the last version when there are 2 or more bars that have the same high or low price
======== ======== ========
ฟีเจอร์
การจับสวิง (จะเป็นสวิง HIGH ก็ต่อเมื่อแท่งนั้นสูงกว่า 2 แท่งก่อนหน้า และ 1 แท่งด้านหลัง, และจะเป็นสวิง LOW ก็ต่อเมื่อแท่งนั้นต่ำกว่า 2 แท่งก่อนหน้า และ 1 แท่งด้านหลัง)
ด๊องแด๊ง (คือเส้นที่ลากสลับไปมาระหว่างสวิง High และ Low ==> ใช้เพื่อดูการเคลื่อนที่ของราคา)
สิ่งที่แก้ไข
แก้ไขการจับสวิงจากเวอร์ชันก่อนหน้า ในกรณีที่มีแท่งเทียน 2 แท่ง หรือมากกว่า มีค่า high หรือ low เท่ากัน
======== ======== ========
Credit: Bravo Trade Academy

2U2DFlipHappy to contribute to the community request for indicators that TheStrat community find useful, I have published the requested 2U/2D flip indicator with built in 'alert' feature.
Adding this indicator to your chart will allow you to use the awesome Tradingview 'alert' functionality to register an alerts when either of these two conditions are true:
- When the candle colour of TheStrat 2U green candle turns RED
- When the candle colour of TheStrat 2D red candle turns GREEN
The significance of this event is an indication that price might have reversed and is more applicable on higher timeframes .
Explanation of 'TheStrat' trading technique
‘TheStrat’ technique works off the basis of labelling whether the focus candle did or did not break any of the previous candles high or low values. There are three possible label definitions; either a 1 candle, 2 candle or a 3 candle.
1 bar (inside) - If price movement on the new candle remains within the high and low of previous candle.
3 bar (outside) – If price movement went above both the high and the low of the previous candle.
2 bar (directional) – If price movement only broke with the high (called a 2-up) or if price movement only broke the low of the previous candle (called a 2-down).
How does the indicator work?
This indicator will allow the user to be alerted when this colour change happens on any ticker and timeframe you have added the indicator to and then register an alert. The key decisions are which TICKER and which TIMEFRAME to register the alert. It will alert for both these conditions within the single alert.
When a registered alert is running it will continually monitor for these conditions and once per bar it will immediately generate the alert notification using the existing built-in TradingView alert feature. This indicator is not market or timeframe specific, in fact this alerting indicator can be used to register alerts on multiple tickers and timeframes simultaneously.
Example of how to use the indicator
Assume you are interested in being alerted for any colour changing candle on AAPL on the 30min timeframe. You would simply go to that chart (APPL on 30 min), add '2U2DFlip' indicator to the chart, then using the built-in TradingView - 'Create Alert' feature to register the alert that will listening to '2U2DFlip' indicator monitored events. In this example the alert will specifically trigger if it finds a 2U candle turning red or a 2D candle turning green and sends the alert allowing you to jump to the chart to review.
Description of the script
The script defines two conditions that incorporate the specific definition of TheStrat 2U and 2D candles, meaning, that in relation to the previous candle it only 'broke' one side of the previous candle and then adds another condition that monitors if the colour changes (close > open) of the current candle.
How is this useful to a trader?
The 2U and 2D candles are known as 'directional' candles in TheStrat community so the fact that a directional candle has 'changed' direction is a significant indication of a reversal. When this event happens a trader would be notified and is in a position to determine if a reversal play might be in order.
Note to moderators
This code is my own code, based on my other popular indicators. It encompasses the definitions of TheStrat community and trading style and was requested by the community users that trade using TheStrat technique. The reason for the source being protected is that it contains my own method of defining TheStrat and source code of my paid indicator.
Good Luck with trading and I hope this indicator helps to increase the profitability of your portfolio. Happy Trading.

Vector MACDCalculates five vector moving averages of different periods and averages them.
Origin moving average is ALMA from the mid point of the candles (hl2.)
Vector moving averages are the difference between Hull Moving Averages and the Origin MA.
It is a momentum indicator that shows when long term and short term trends agree with the move. It moves stronger, when all the vectors point to the same direction.
Look for divergence to detect trend changes.

Cuck WickAcknowledgement
This indicator is dedicated to my friend Alexandru who saved me from one of these scam cuck wicks which almost liquidated me.
Alexandru is one of the best scalpers out there and he always nails his entries at the tip of these wicks.
This inspired me to create this indicator.
What's a cuck wick?
It's that fast stop-hunting wick that cucks everyone by triggering their stop-loss and liquidation.
Liquidity is the lifeblood of stock market and liquidation is the process that moves price.
This indicator will identify when a liquidity pool is getting raided to trigger buy or sell stops, they are also know as stop-hunts.
How does it work?
When market consolidates in one direction, it builds up liquidity zones.
Market maker will break out of these consolidation phases by having dramatic price action to either pump or dump to raid these liquidity zones.
This is also called stop-hunts or liquidity raids. After that it will start reversing back to the opposite direction.
This is most noticeable by the length of the wick of a given candle in a very short amount of time and the total size of the candle.
This indicator highlights them accordingly.
Settings
Wick and Candle ratio works with default values but finetune will enhance user experience and usability.
Wick Ratio: Size of the wick compared to body of a candle.
Adjust this to higher ratio on smaller timeframe or smaller ratio on bigger timeframe to your trading style to spot a trend reversal.
Candle Ratio: The size of the candle, by default it is 0.75% of the current price.
For example, if BTC is at 20,000 then the size of the candle has to be minimum 150.
This can be fine tuned to bigger candle size on higher time frames or smaller for shorter timeframe depending on the trade type.
How to use it?
This indicator will identify when a liquidity pool is getting raided to trigger buy or sell stops, they are also know as stop-hunts. It can be used of its own for scalping but there are also a good few indicators which would most definitely help to confluence bigger timeframe trades.
Scalp
This indicator shows the most chaotic moments in price action; therefore it works best on smaller timeframes, ideally 3 or 5 minute candle.
- Wait for the market to start pumping or dumping.
- Current candle will change colour (Bullish/Bearish).
- Enter trade as soon as price starts to reverse back.
- Place the stop-loss outside of the current candle.
- Wait for the cuck wick to appear as confirmation.
Price is very chaotic during a liquidity stop-hunt raid but there is a saying:
"In the midst of chaos, there is also opportunity" - Sun-Tzu
Since this is a very high risk, high reward strategy; it is advised to practice on paper trade first.
Practice until perfection and this indicator would be the perfect bread and butter scalp confirmation.
Fair Value Gap
FVG strategy is the most accurate in conjunction with this indicator.
Normally price would reverse after consuming fair value gaps but often it's difficult to know when and where.
This indicator would identify those crucial entry points for reverse course direction of the price action.
Support and Resistance
This indicator can also be used in conjunction with support and resistance lines.
Generally the cuck will go deep below the support or spike much further up the resistance lines to liquidate positions.
Bollinger Bands
Bolling Bands strategy would be to wait until the price breaks out of the band.
Once the wick is formed, it would be an ideal entry point.
Script change
This is an open-source script and feel free to modify according to your need and to amplify your existing strategy.

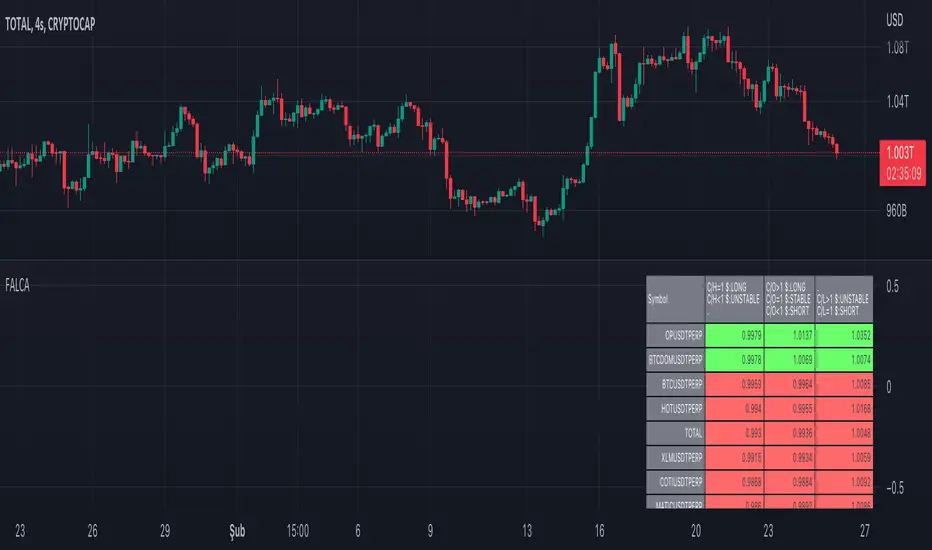
Futures All List Candle Analysis - FALCAIn this command; There is an alphabetical list of USDS-M coins with the USDT PERP extension on the Binance Futures side.
There are 13 lists in total. Each list contains 39 data. Due to data limitation, 13 lists are formed. There are 13 coins in the first 11 of the lists. The 12th list contains 3 coins. The last list (FAVORITE LIST) is CRYPTOCAP:TOTAL, BINANCE:BTCUSDTPERP, BINANCE:BTCDOMUSDTPERP as standard. You must add 10 coins to the final list.
The lists show data for the time period you selected.
Explanation of the (C/H) header: Close /High takes a maximum value of 1. As long as this value is 1, a price increase is observed.
Explanation of the (C/O) header:
Close /Open can be greater than ,1. In this case, a price increase is observed.
Close /Open can be less than 1. In this case, a price decrease is observed.
The value Close /Open can be equal to 1. In this case, price stability is observed.
Explanation of the (C/L) header: Close /Low takes a minimum value of 1. As long as this value is 1, a price decrease is observed.
Coins with a price decrease are shown in red.
Coins with a price increase will turn green.
***NOTE: For this command to work, you must first add 10 favorite coins to the "FAVORITE LIST".
Engulfing Pinbar [serkany88]This is an experimental candlestick pattern that combines pinbars and engulfing patterns as my own implementation. These signals can be used as a possible reversal points based on timeframe used or set wick size. Of course these signals should never be used on their own but rather can be used as another confluence of possible entry signal.
Functional and Manual alerts provided with simple and clean code.
TLDR: Use as a possible reversal point for your entries in combination with your trend and volatility filters. Green means possible bullish move, Red means possible bearish move.

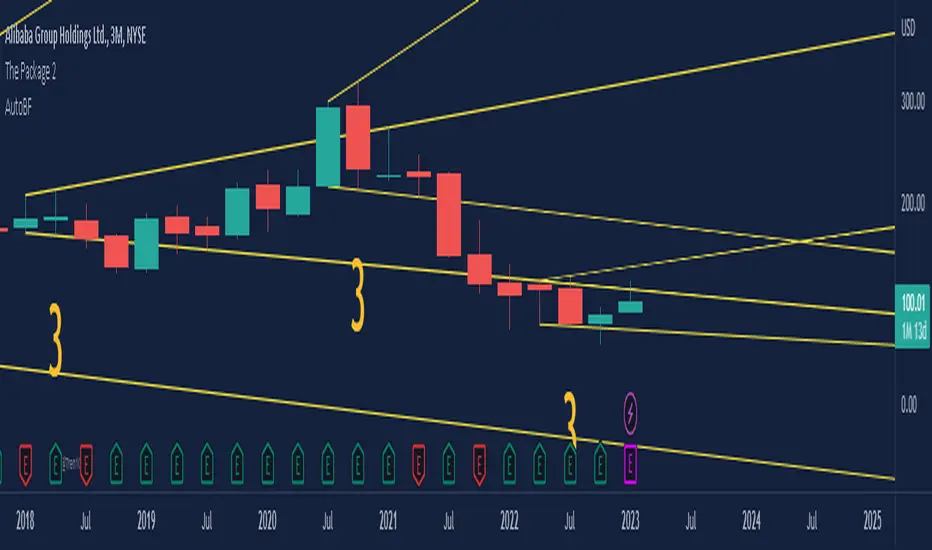
AutoBF by Tren10xBroadening Formation is a powerful technical analysis tool that is characterized by two converging trendlines that widen over time. This pattern typically signals a period of volatility and uncertainty in the market and can indicate a potential reversal in trend direction.
This script uses advanced algorithms to automatically detect and plot broadening formations on your chart, making it easy to identify these patterns and potentially profit from them, all while saving you time from drawing them yourself. With customizable settings, this indicator is a must-have tool for any trader looking to take advantage of this powerful chart pattern.
Features:
● Automatically detects and plots broadening formations on any chart within TradingView
● Customizable settings for greater flexibility and control
● Choose to draw your broadening formation from the outside bar to the "Previous Candle" or "Compound Candle" aka to the previous lowest/highest candle within the outside bar.
● Clear visual display of broadening formations and easy identification
● Compatible with all markets and timeframes, from stocks and forex to cryptocurrencies and commodities
● Designed for both novice and experienced traders, with user-friendly interface and comprehensive documentation
● By default, the year will look back 75 years, the quarter will look back 20 years, the month will look back 7 years, the week will look back 3 years, and the day will look back 90 days. However, you now have the ability to change these at your will.
● Added the ability to enable Broadening Formations on the 6 Month, 2 Month, 2 Week, and 2 Day charts.
● ALERTS! Receive timely notifications when the price breaches or activates a broadening formation.
All Timeframes available:
● Year
● 6 Month
● Quarter
● 2 Month
● Month
● 2 Week
● Week
● 2 Day
● Day
tinyurl.com
Predicting future outcomes is impossible. Nobody knows what the future will bring. With this Broadening Formation Indicator, you will have the edge you need to identify potentially profitable trading opportunities and make more informed decisions in the markets.
Regards,
Tren10x
Disclaimer: It is essential to note that returns on investments are not guaranteed, and investors should exercise prudence in conducting thorough due diligence before making any investment decisions
I would like to express my gratitude to my wife for her meticulous testing and insightful contributions throughout the course of this project. Additionally, I extend my appreciation to the esteemed Alpha Pack Group, whose exceptional acumen and investment expertise have been instrumental in the success of this endeavor.
Footprint ClassicThe Volume Footprint chart is analyzing volume data contained within candles and split it into two components - Up and Down volume. This analysis is similar to how Volume Profile evaluates volume data from a portion of the chart.
This script can be used by any user. You do not need to have PRO or PREMIUM account to use it.
As a user, you have the flexibility to select the desired level of data precision for the Volume Footprint analysis. We highly recommend using the highest precision possible, as it provides the most accurate results. However, it's important to keep in mind that Trading View has several limitations and not all levels of precision are available on all intervals. The higher the precision, the shorter the history of available data.
If, after adding the script or changing the precision, you encounter an error message stating "'The study references too many candles in history'", it may be necessary to reduce the precision level in the script settings to resolve the issue.
This script is a part of the "Volume Footprint" toolkit, which includes:
I. Footprint chart visualization scripts in two variants:
⠀⠀Volume Footprint - Presenting volume data on both sides of the candle.
⠀⠀Volume Footprint Classic - Presenting volume data on the right side of the candle.
II. Supporting tools:
⠀⠀Volume Footprint Statistics - Script presents, in tabular form, basic statistics calculated from candle volume data, such as Delta, min Delta, max Delta and more. It can support both Volume Footprint and Volume Footprint Classic.
⠀⠀Volume Footprint Candles - Tool drawing candles adapted for footprint chart scripts.
III. Tools dedicated to more detailed analysis:
⠀⠀Volume Delta - A candle chart illustrating changes in delta values.
⠀⠀Volume Cumulative Delta - A candle chart ilustrating changes in cumulative delta values.
⠀⠀Volume Delta In Candle - A line chart showing changes in delta values over a period equal to the chart interval.
⠀⠀Volume Cumulative Delta in Interval - A line chart showing changes in cumulative delta over a period equal to the chart interval.
Script with limited access, contact author to get authorization
User Interface:
The script groups Up and Down volume into slots based on price. The height of the slots is controlled by the "Slot height" parameter in the settings. Each slot has the following configurable features:
Text - A label that displays the value. You can choose from:
⠀- - Hidden
⠀V - Slot Volume (UP + Down)
⠀V% - Slot volume as percentage of Candle volume
⠀UD - Up and Down volume
⠀UDI - Up and Down volume + Imbalance symbols.
⠀Δ - Delta (Up - Down Volume)
⠀Δ% - Delta as percent of slot volume (from -100% to 100%)
Border - Highlight slots with border color. You can chose from:
⠀- - Hidden
⠀C - Constant color
⠀POC - Slot with biggest volume
⠀V - Slot volume compared to other slots in that candle
⠀VA - Value area, highlights slots forming the value area
⠀Δ - Delta is the slot.
Background - Highlight slots with background color. You can pick one of:
⠀- - Hidden
⠀C - Constant color
⠀POC - Slot with biggest volume
⠀V - Slot volume compared to other slots in that candle
⠀VA - Value area, highlights slots forming the value area
⠀Δ - Delta is the slot.
Imbalances symbols:
Before the Down Volume, the following imbalance symbols may appear:
⠀↓ - 3 times
⠀↡ - 5 times
⠀⇊ - 10 times
After the Up Volume the following imbalance symbols may appear:
⠀↑ - 3 time
⠀↟ - 5 times
⠀⇈ - 10 times
Above the candle, the following basic statistics can be shown:
"V:" - Row with volume statistics:
⠀∑ - Total volume ,
⠀Δ - Difference between Up and Down Volume .
⠀min Δ - The smallest difference between Up and Down Volume in that candle
⠀max Δ - the biggest difference between Up and Down Volume in that candle
Script settings:
Slot height = 10^ - Price slot height on the chart, recorded as a power of 10, which means:
⠀ 0 - 1$
⠀ 1 - 10$
⠀ 2 - 100$
⠀ 3 - 1000$
⠀-1 - 0.1$
⠀-2 - 0.01$
⠀-3 - 0.001$
Data precision - One of 6 standard levels of data precision: ▉▇▆▅▃▁, where ▉ means the highest precision and ▁ the lowest available precision and two special values "W" and "M" dedicated for biggest intervals. The highest precision should be available for 15-minute chart, but for a 1D chart, it may hit TradingView limitations and the script will not be launched by the platform with error: "'The study references too many candles in history'". The general recommendation is to use the highest available precision for a given instrument and interval.
Precise warnings - An option to show warnings about missing volume in candle footprint (warning connected with one of TradingView limitations).
Text - Picking what king of info is on label:
⠀- - Hidden
⠀V - Total slot Volume
⠀V% - Slot volume as % of Candle volume
⠀UD - Up and Down volume
⠀UDI - Up and Down volume + Imbalance symbols.
⠀Δ - Delta
⠀Δ% - Delta as percent of slot volume
Centered - If checked volume labels are stick to candle (centered), if not they are alligned to right.
Border, Background:
⠀- - Hidden
⠀C - Color1
⠀POC - Slot with biggest volume
⠀V - Slot volume compared to other slots in that candle
⠀VA - Value area, highlights the slots forming the value area
⠀Δ - Delta is the slot, color1 is used when volume Up is at least 10% bigger, color2 is used when Volume Down is at least 10% bigger
Filter - Filtering option than allow hinding labels with small values:
⠀0 - filter turned off.
⠀1-5 - filtering with transparency
⠀6-10 - Filtering with hiding values
Show zeros - Option to show zeros or leave empty spaces
Draw candles - Option to draw candles that fit the volume labels, and 2 fields to choose the color of up and down candles. It is recommended to hide chart candles and use candles adapted to the footprint chart. TradingView has a bug and candles are drawn under the slots. If you choose a non-transparent background or border, they may be invisible. If possible (free accounts have a limit of 3 scripts), it is recommended to use Volume Footprint Candles script to draw thin candles over the slots.
Show stats - Showing stats over the candle: ∑, Δ, min Δ, max Δ. It's recommended to use 'Volume Footprint Statistics' script instead
Font size - Used to draw stats over the chart: T(iny), S(mall), N(ormal), L(arge)
Instrument and Volume status - A dialog showing basic chart information: Instrument type, Volume type, Smallest change, slot height.
Value area - Value area is the smallest group set of neighboring slots that have at least n(param) % of candle volume.
⠀ Value Area Minimal Volume (%) - Value area size as % of candle volume
⠀ Track - Option to track value areas, potencial support-resistance zones.
⠀ Only active - Option to hide areas that were crossed by the price.
⠀ Show Values - Opiton to show volume value over tracked value areas.
Alerts:
⠀ One alert per Bar - Emits no more than one alert per bar.
⠀ Add value area to tracking - Emits an alert about a new VA beeing added to the tracking list.
⠀ Remove value area from tracking - Emits an alert when a VA is removed from the tracking list.
Troubleshooting:
In case of any problems, please send error details to the author of the script.
Known issues:
"The study references too many candles in history" - If you encounter this issue, try changing "Data precision" setting to a lower value.

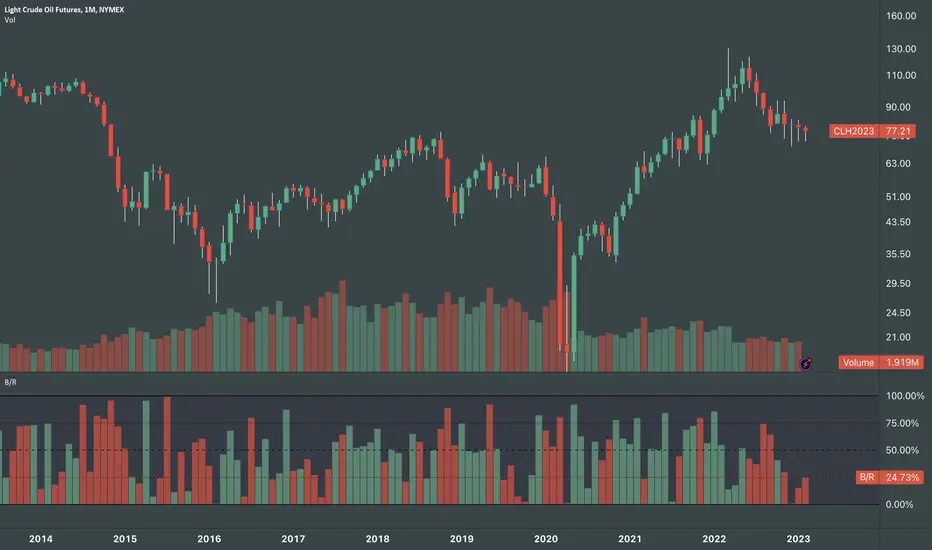
Body / Range %Body / Range is a volatility indicator that shows how many percentages the body candle occupies the range.
The ratio tells us about the health and confidence of the current candlestick.
Since overall candle Range is always bigger than the body range, Body/Range indicator will always fluctuate inside a range of 0 and 100%.
I didn't use True Range because it considers gaps and the ratio won't be considering individual candles. Therefore, I used high - low and identified it as Range.
In this function, the wicks play obviously role in determining the ratio too without its variable separately in the formula. I wouldn't use wicks here because Range = body + total wicks anyway. It already covers the variable. If I made the ratio with Body / Total Wicks, we wouldn't have stable 0 - 100% range of the indicator by the way. So it's fully justified dividing Body by Range to get some summarized Candle Metrics.
Logically we assume that if wicks are relatively bigger than body then the ratio will be relatively smaller and vice versa.
Change TF of the indicator is possible. For example, 3 months per bar would look like this:
The Candle Hunter Candlestick Pattern - by Karoshi TradingThe Candle Hunter Indicator - by Karoshi Trading
The Candle Hunter Indicator is based on specific Candlesticks and Patterns.
Activating this indicator will mark all specific Bullish & Bearish Candles on the Chart.
Depending on your settings, not all candles will be displayed on the chart.
The goal of this indicator is, to highlight all the important trending candles and ignore all ranging candles.
This can be helpful for rejecting/bouncing zones or S&R Levels. Or even if you like to trade reversals, you do not want to trade it on low volume ranging candles.
This indicator should only be used as a supplementary tool while trading, not as a stand alone.
Which Candles & Pattern will be marked on the chart?
1# Pinbar / Hammer (multiple Variations)
2# Marubozu Candles (multiple Variations)
3# Engulfing Candles (Multiple Variations)
How does this indicator works?
First of all, the indicator has to calculate 3 different parameters, before marking one of the given candle. To do so, we will need the average volume, average candle size and the specific candles.
1st Parameter: Defining the needed Candles
First of all, the indicator will calculate, based on the opening & closing price and also the wick (range of each candle). If one of the calculation is a match, for the mentioned candles above, we come to step 2.
2nd Parameter: Average Candle Size
The next one is the size of each candle, compared to the average candle on the chart.
You can customize the settings, but in this example, we want the specific candle be at least 1.5 times the size of the average last 14 candles.
3rd Parameter: Average Volume
The indicator will now calculate the average volume of the last selected candles period (default settings = 14) and compare it to the current candle. In this example, the current candle should be at least 1.5 times the average volume.
The indicator provides two possibilities to calculate the average volume:
1# Volume MA = Volume Moving Average
2# Volume SA = Volume Simple Average
Result: Colorizing the given Candle
After all parameters were met, the indicator will colorize and mark with a label + name all the candles on the chart.
Special Settings:
1st The Engulfing Candles, have 3 different options:
1# Classic = Only the body of the previous candle has to be engulfed by the current candle
2# Reinforced = The full candle + wick of the previous candle has to be engulfed
3# Multiple Candles = Minimum 3 previous candles has to be engulfed to be marked on the chart
The numbers of candles are changeable and you can have all 3 options simultaneously active.
That means, that the code will check all 3 options to see if there is a match.
2nd Marubozu Candle
You can set the ratio between body compared to wick in the settings. Depends if you want full marubozu candles or also the variations of it.
3rd Hammer Wick
You can decide how much bigger the wick should be, compared to the body of the candle. The default settings are set on 1.5 times.
You can also set the position of the body. As example if the settings are set on 30%, the body of the hammer should be on the upper half of a bullish hammer or the lower 30% of the candle if bearish.

InsideBar2.0Inside Bar: Inside Bar is defined as, " when candle body range falls within previous day candle body".
Some of us take the whole prices range . Here i have taken only the price range of the body of tehecandle.
I have created an indicator to identify Inside bras and draw target levels on both the sides. Traders can easily convert it into a strategy and checkout the success rate.
This script is written to identify InsideBar and then plot target 1 and target 2 irrespective the direction of following candles.
Inside Bar is here defined clearly when the whole body( Not high/Low, but Open and Close Only of the candle falls within the whole body of previous candle
Few static Variables are declared for one time use to store the following values
MotherCandle Index
High and Low of MotherCandle
Target 1 equal to size of the body of mother candle
Target 2 equal twice the size of Mother Candle
Depending upon the direction of the trend and breakout of the MotherCandle boundaries, target lines and labels are drawn.
Line.delete function is used to delete all the previous lines to keep the chart clean and not draw line on all every inside-bar detected in the past.
Label.delete function is used to delete all the previous labels for Target levels to clearly show current target levels.
barcolor() function is used to change the inside bar candle changed to "Yellow" .

Glan Nilly candle TrendThis script is based on Nilly River Theory, and shows up, down, inner and outer bars according that concept.
it can be used for trend recognition. blue after blue candles show continuation of an upward trend.
red after red candles show continuation of a downward trend. gray candles are members of the trend they are within.
An opposite candle color to previous candles shows minor trend reversal. high of the last candle of a blue after blue candles shows a new up(grey candles within the way are part of that trend).
low of the last candle of a red after red candles shows a new down(grey candles within the way are part of that trend).
if the new up is upper and new down is upper than previous ones, then this is real upward trend. if the new up is lower than and new down is lower than previous ones, then this is real downward trend. it is not allowed to trade in opposite direction of a trend and this indicator help us to recognize the trend.
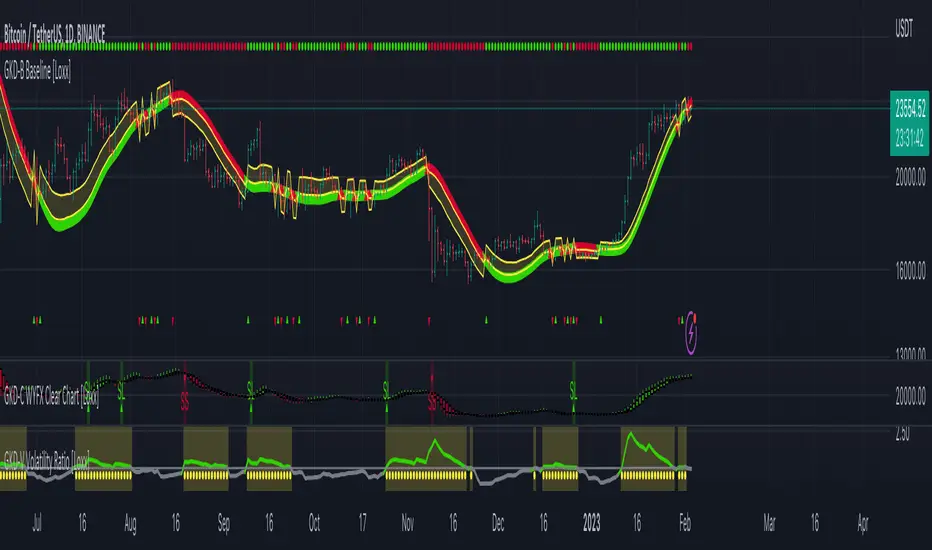
GKD-C WYFX Clear Chart [Loxx]Giga Kaleidoscope WYFX Clear Chart is a Confirmation module included in Loxx's "Giga Kaleidoscope Modularized Trading System".
█ Giga Kaleidoscope Modularized Trading System
What is Loxx's "Giga Kaleidoscope Modularized Trading System"?
The Giga Kaleidoscope Modularized Trading System is a trading system built on the philosophy of the NNFX (No Nonsense Forex) algorithmic trading.
What is an NNFX algorithmic trading strategy?
The NNFX algorithm is built on the principles of trend, momentum, and volatility. There are six core components in the NNFX trading algorithm:
1. Volatility - price volatility; e.g., Average True Range, True Range Double, Close-to-Close, etc.
2. Baseline - a moving average to identify price trend
3. Confirmation 1 - a technical indicator used to identify trends
4. Confirmation 2 - a technical indicator used to identify trends
5. Continuation - a technical indicator used to identify trends
6. Volatility/Volume - a technical indicator used to identify volatility/volume breakouts/breakdown
7. Exit - a technical indicator used to determine when a trend is exhausted
How does Loxx's GKD (Giga Kaleidoscope Modularized Trading System) implement the NNFX algorithm outlined above?
Loxx's GKD v1.0 system has five types of modules (indicators/strategies). These modules are:
1. GKD-BT - Backtesting module (Volatility, Number 1 in the NNFX algorithm)
2. GKD-B - Baseline module (Baseline and Volatility/Volume, Numbers 1 and 2 in the NNFX algorithm)
3. GKD-C - Confirmation 1/2 and Continuation module (Confirmation 1/2 and Continuation, Numbers 3, 4, and 5 in the NNFX algorithm)
4. GKD-V - Volatility/Volume module (Confirmation 1/2, Number 6 in the NNFX algorithm)
5. GKD-E - Exit module (Exit, Number 7 in the NNFX algorithm)
(additional module types will added in future releases)
Each module interacts with every module by passing data between modules. Data is passed between each module as described below:
GKD-B => GKD-V => GKD-C(1) => GKD-C(2) => GKD-C(Continuation) => GKD-E => GKD-BT
That is, the Baseline indicator passes its data to Volatility/Volume. The Volatility/Volume indicator passes its values to the Confirmation 1 indicator. The Confirmation 1 indicator passes its values to the Confirmation 2 indicator. The Confirmation 2 indicator passes its values to the Continuation indicator. The Continuation indicator passes its values to the Exit indicator, and finally, the Exit indicator passes its values to the Backtest strategy.
This chaining of indicators requires that each module conform to Loxx's GKD protocol, therefore allowing for the testing of every possible combination of technical indicators that make up the six components of the NNFX algorithm.
What does the application of the GKD trading system look like?
Example trading system:
Backtest: Strategy with 1-3 take profits, trailing stop loss, multiple types of PnL volatility, and 2 backtesting styles
Baseline: Hull Moving Average
Volatility/Volume: Volatility Ratio as shown on the chart above
Confirmation 1: WYFX Clear Chart as shown on the chart above
Confirmation 2: Williams Percent Range
Continuation: Fisher Transform
Exit: Rex Oscillator
Each GKD indicator is denoted with a module identifier of either: GKD-BT, GKD-B, GKD-C, GKD-V, or GKD-E. This allows traders to understand to which module each indicator belongs and where each indicator fits into the GKD protocol chain.
Giga Kaleidoscope Modularized Trading System Signals (based on the NNFX algorithm)
Standard Entry
1. GKD-C Confirmation 1 Signal
2. GKD-B Baseline agrees
3. Price is within a range of 0.2x Volatility and 1.0x Volatility of the Goldie Locks Mean
4. GKD-C Confirmation 2 agrees
5. GKD-V Volatility/Volume agrees
Baseline Entry
1. GKD-B Baseline signal
2. GKD-C Confirmation 1 agrees
3. Price is within a range of 0.2x Volatility and 1.0x Volatility of the Goldie Locks Mean
4. GKD-C Confirmation 2 agrees
5. GKD-V Volatility/Volume agrees
6. GKD-C Confirmation 1 signal was less than 7 candles prior
Continuation Entry
1. Standard Entry, Baseline Entry, or Pullback; entry triggered previously
2. GKD-B Baseline hasn't crossed since entry signal trigger
3. GKD-C Confirmation Continuation Indicator signals
4. GKD-C Confirmation 1 agrees
5. GKD-B Baseline agrees
6. GKD-C Confirmation 2 agrees
1-Candle Rule Standard Entry
1. GKD-C Confirmation 1 signal
2. GKD-B Baseline agrees
3. Price is within a range of 0.2x Volatility and 1.0x Volatility of the Goldie Locks Mean
Next Candle:
1. Price retraced (Long: close < close or Short: close > close )
2. GKD-B Baseline agrees
3. GKD-C Confirmation 1 agrees
4. GKD-C Confirmation 2 agrees
5. GKD-V Volatility/Volume agrees
1-Candle Rule Baseline Entry
1. GKD-B Baseline signal
2. GKD-C Confirmation 1 agrees
3. Price is within a range of 0.2x Volatility and 1.0x Volatility of the Goldie Locks Mean
4. GKD-C Confirmation 1 signal was less than 7 candles prior
Next Candle:
1. Price retraced (Long: close < close or Short: close > close )
2. GKD-B Baseline agrees
3. GKD-C Confirmation 1 agrees
4. GKD-C Confirmation 2 agrees
5. GKD-V Volatility/Volume Agrees
PullBack Entry
1. GKD-B Baseline signal
2. GKD-C Confirmation 1 agrees
3. Price is beyond 1.0x Volatility of Baseline
Next Candle:
1. Price is within a range of 0.2x Volatility and 1.0x Volatility of the Goldie Locks Mean
3. GKD-C Confirmation 1 agrees
4. GKD-C Confirmation 2 agrees
5. GKD-V Volatility/Volume Agrees
█ WYFX Clear Chart
What is WYFX Clear Chart?
WYFX Clear Chart a variation of Heiken-Ashi candles that uses 62 different types of smoothing.
Requirements
Inputs
Confirmation 1 and Solo Confirmation: GKD-V Volatility / Volume indicator
Confirmation 2: GKD-C Confirmation indicator
Outputs
Confirmation 2 and Solo Confirmation: GKD-E Exit indicator
Confirmation 1: GKD-C Confirmation indicator
Continuation: GKD-E Exit indicator
Additional features will be added in future releases.
PinBar Detector [Mr_Zed]Pinbar Detector is a technical analysis tool designed to detect Pinbar patterns in financial markets. Pinbars are reversal patterns that indicate a potential change in trend.
This indicator is based on an existing Pinbar detector in MQ4/5 format, originally developed by "earnforex".
The PineScript version is written to work in TradingView, and can be applied to any chart to identify Pinbar formations. The indicator uses specific criteria to identify Pinbars, such as the length of the wick and the relationship between the wick and the body of the candlestick. By displaying the Pinbars on the chart, traders can make informed decisions about entering or exiting trades based on their analysis of the market's potential trend reversal.
enjoy !
