Weighted stdev/BBThe basis/mean is the equivalent to the pine built in function wma(). It assigns greater weighting to recent data points and less weighting on past data points. The weighted moving average is calculated by multiplying each observation in the data set by a predetermined weighting factor.
Similarly the stdev is calculated using the same weighting factors where recent deviations are given greater weight than past deviations.
Bollinger Bantları (BB)

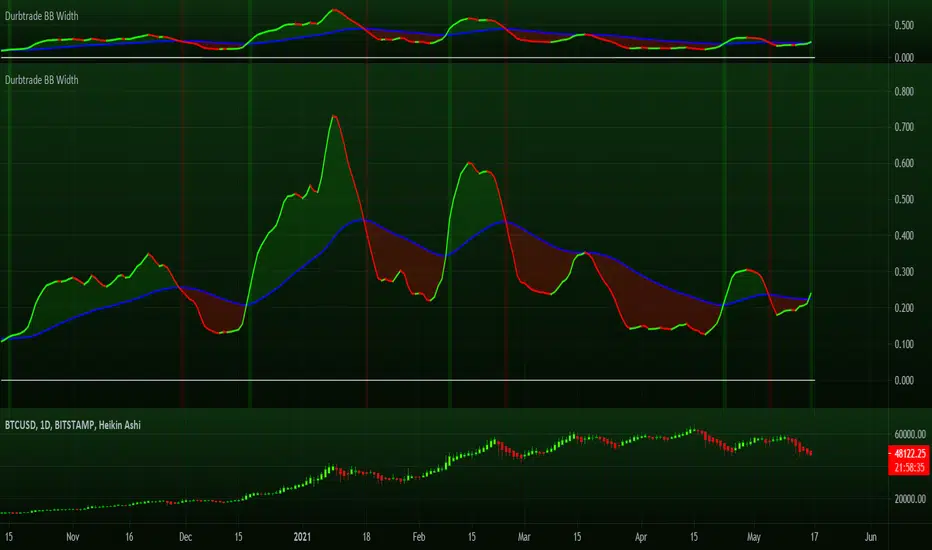
Durbtrade Bollinger Bands WidthFirst published script. Actually, this is my 1st script ever! I know its not flashy or anything, but I finally decided to try learning some pine... and to try and get rid of the dang 0 on my profile, haha. So here are the results after many hours.
I like using the BB Width indicator, and I wanted it to change color based on whether is was rising or falling. I also have it to automatically plot a horizontal line at 0 so I don't have to draw a line every time I apply the indicator to a new chart. And I changed the default precision to 3.
I noticed that there aren't that many BB Width scripts. and I don't think there is anything like this out there that I know of, so I hope someone else besides me will find it useful.
Please feel free to comment.
TV Community AlgoTV Community Algo is a free TradingView script that I designed from the ground to benefit the traders of this community. It has plenty of features that you will enjoy, and I have included documentation for how to use this below!
Settings:
Basic:
Turn the Void Lines on or off
Turn the Dashboard on or off
Turn the Signal Bars on or off
Turn the Support & Resistance Lines on or off
Turn the EMA 8 and EMA 200 on or off
Turn the Buy & Sell Signals on or off
Turn the Fibonacci Retracement Tool on or off
Style:
Change the Dashboard's distance from the price action
Change the Dashboard's Color and Transparency
Change the Dashboard Text Color
Change the Fibonacci Deviation
Make the Fibonacci Retracement Tool reverse
Make the Fibonacci Lines extend left, right, both directions, or none
Turn Fibonacci Prices on or off
Turn Fibonacci Levels on or off and change between percent or value
Change Fibonacci Label Position from the left or the right
Usage:
This algo has many uses including but not limited to:
Finding entries and exits using the EMA 8 and EMA 200 crossovers
Using the Void Lines to identify bounces or reversals
Using the Signal Bars to identify trend and confirmation for entries and exits
Using the Dashboard information for confirmation and informational purposes
In the images below, I give a few examples of the many uses of the TV Community Algo!
VOID LINES
The Void Lines are very helpful when it comes to identifying reversals.
TV COMMUNITY ALGO DASHBOARD
The Dashboard is filled with useful information that all traders can benefit from!
SIGNAL BARS
The colored candles known as Signal Bars inform you of when the price action is above or below the midpoint of the Void Lines.
AUTO SUPPORT & RESISTANCE LINES
These lines help traders find accurate levels of support & resistance on all time frames, and the lines change color depending on if the price is above or below them.
EMA 8 AND 200
The EMA 8 and EMA 200 crossovers can be used as entry and exit signals.
BUY & SELL SIGNALS
The BUY & SELL signals can be used to find optimal entries and exits for trades on any time frame. Smaller time frames are best for scalping, while larger time frames are more suited for longer trades. When combined with the EMA lines and Dashboard information, these signals can produce incredibly profitable trades.
AUTO FIBONACCI RETRACEMENT TOOL
The Auto Fibonacci Retracement Tool allows you to plot perfect Fib Lines every time.
Conclusion:
I truly hope that the TV Community Algo benefits the TradingView community and that you all find some value in it. I worked very hard on this product and I would love to see it put to good use.
with love,
-Lemon 🍋
This work is licensed under a Attribution-NonCommercial-ShareAlike 4.0 International (CC BY-NC-SA 4.0) creativecommons.org

Inverse BandsThis was the result of quite some time spent examining how much information could be gleamed by studying the interactions between Keltner Channels, STARC Bands and Bollinger Bands. I was surprised by the results.
First of all, there are four fills that are black. Set the transparency of those to 0 and you'll see this indicator the way that it's meant to be seen. Those fills belong to unused sections of the Bollinger Bands.
There are two clouds which represent STARC Bands and the Keltner Channel. There is some delay when they flip from bullish (green) to bearish (red), but they are indicative of the trend. The space between them is black and the narrower that space is, the greater volatility is. Because of this, we don't need the exterior Bollinger Bands.
The Bollinger Bands remain visible as the yellow interior clouds on the top cloud and the blue interior clouds on the bottom cloud. Often, the thicker the yellow or blue cloud is, the less severe a throwback from a given trend reversal will be. Often the thinner that yellow or blue cloud is, the more severe the trend reversal will be. If price is rising into a thin interior yellow cloud, the following dip will be substantial. If price action dips towards a thicker interior blue cloud, often the pump following that dump will be less enthusiastic.
We preserve the Keltner Channel and STARC bands as our cloud because the way that they interact with the three basis lines yields a lot of information.
The yellow Bollinger basis line tells us about trend strength. The closer the BB basis line is to the top of the top cloud or the bottom of the bottom cloud, the stronger the trend is. When it enters the cloud very close to the bottom of the bottom cloud, you know you're looking at a strong pump, and vice versa when it's close to the top of the top cloud.
The purple Keltner Channel basis line and orange STARC Band basis line can forecast short term trend changes one candlestick in advance by contacting any line in either cloud. The moment either basis line touches or crosses any boundary of the clouds, you know that the next candle will change directions. In an uptrend, a touch or cross means the next candle will have a lower high point. In a downtrend, a cross or touch means the next candle will have a higher high point. This is most useful in scalping.
It'd be pretty easy to slap some crossover alerts on to this and useful considering that they come a candle in advance. Feel free to further explore and develop this.

(FireflyTA) BB Pressure HeatmapThis is a simple heatmap based on multi-timeframe Bollinger Bands to find range support & resistance . It makes dynamic confluence zones visible and can be used to add evidence to a thesis or as a basis for a custom range S&R trading strategy.
Colors are optimized for a dark chart layout.
There are currently 3 presets ( LTF , MTF, HTF) available in case you don't know how to customize the BB settings.
You need to add two of these to show support AND resistance at the same time.
Enjoy!

Bollinger Bands + RSI Alerts for 3commas/DCA botHey Folks !
This is in indicator that generates buy alerts combining Bollinger Bands and RSI.
RSI validates the BB signal by confirming we are not in an oversold area.
Interval: 3m to 15m
Recommended settings for 3commas DCA bot
- TP/TTP: 0.3%/0.1%,
- Base Order: Your choice ,
- Safety Order: 1.2 * Your choice of base order
- Safety Order Volume Scale: 1.2,
- Safety Order Step Scale: 1.5,
- Price Deviation to Open Safety Order (% from initial order): 0.25%,
- Max Safety Trades Count: 7
- DO NOT USE STOP LOSS
> Create Alert with Buy Alert and link it to "Message for deal start signal"

6 Bollinger Bands (1.5 thru 4)20 period SMA Bollinger Bands with the following standard deviations: 1.5 2 2.5 3 3.5 4

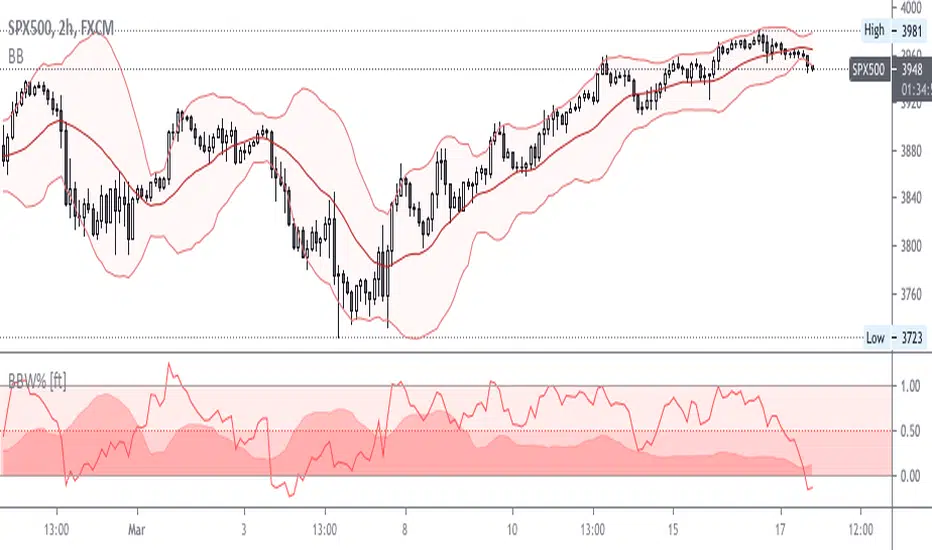
BB Width + %B - All-in-One!Simple and effective script for BB-addicted!
Fully customizable. Clean chart, realtime data.
Add "BBW Multiplier " to adjust width & %D through different mkts volatility.
Default value suites actual S&P.
Enjoy!
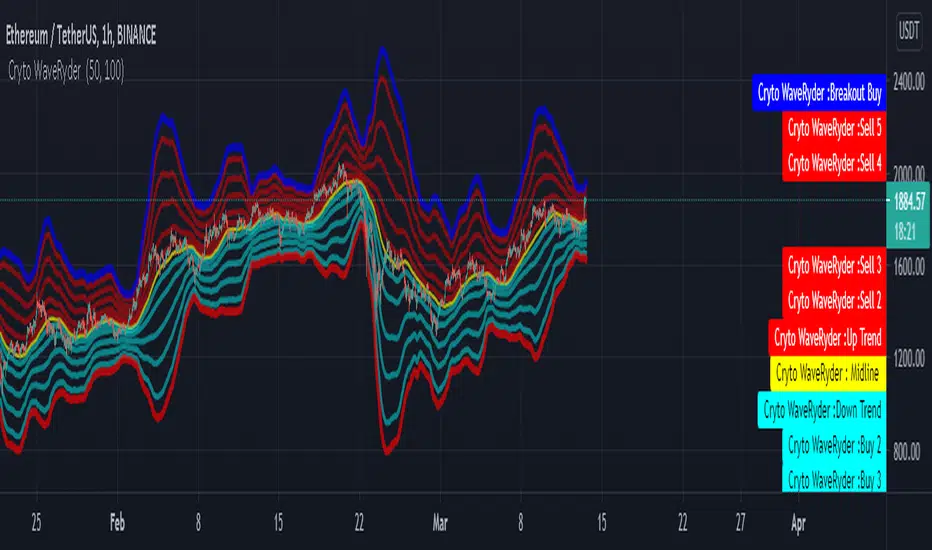
Cryto WaveRyder ------ Phat Cryto WaveRyder are envelopes plotted at a standard deviation level above and below a simple moving average of the price. ... Cryto WaveRyder helps determine whether prices are high or low on a relative basis. They are used in pairs, both upper and lower bands and in conjunction with a moving averange.
I create a lot of Buy/Sell entry, therefore tranders can know where it is the best entry to take the place. Let's make some money with this indicator
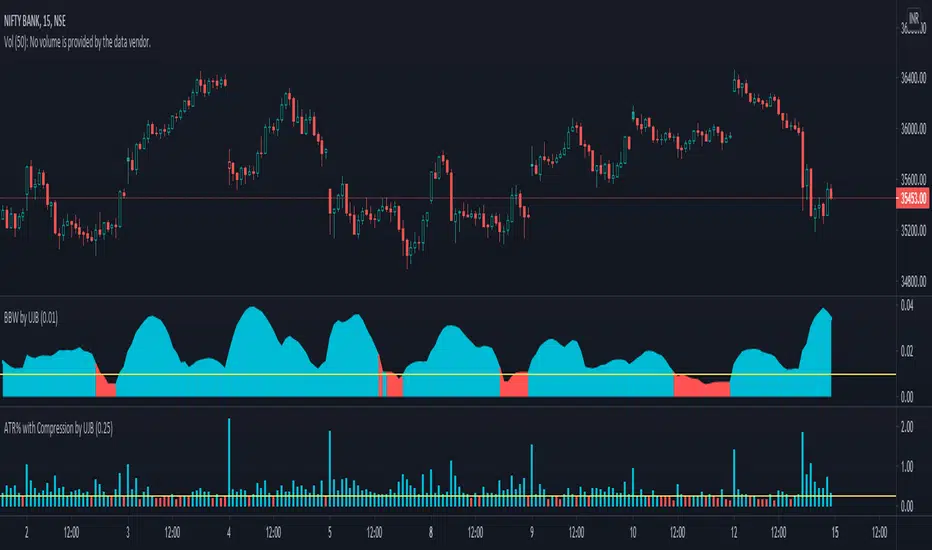
Bollinger Bands Width with Compression by UJBBollinger Band width % with compression line and color changing area.
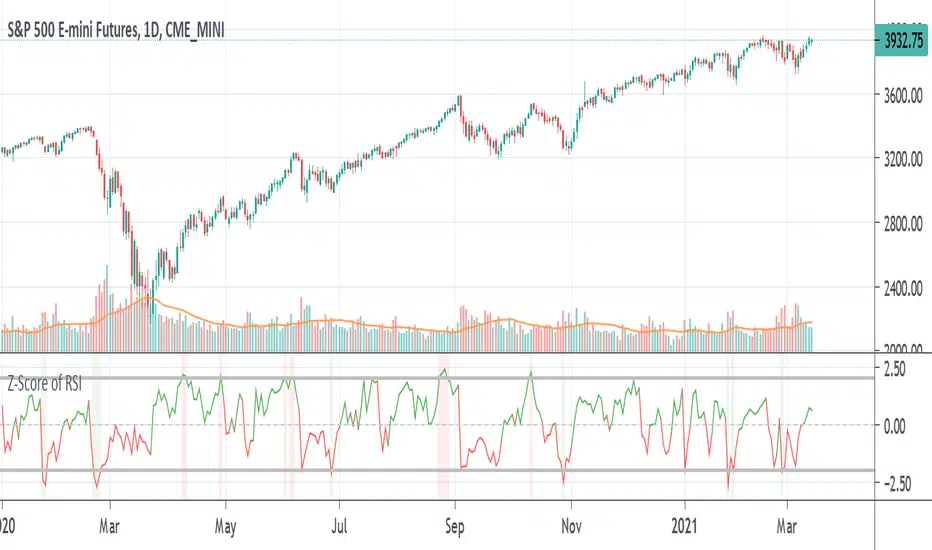
Z-Score of RSIA way to see whether RSI is overbought or oversold inside its Bollinger Bands in the form of an oscillator. Z-score tells you how far the data is from the mean in terms of standard deviations. The numbers shown in the indicator are the number of standard deviations away from the average or mean. Like Bollinger Bands, if it is above the standard deviation border lines then it is considered to be outside the distribution or Bollinger Band. If it is above the upper border line then is it is overbought, if it is below the lower border line then is is oversold.
Example of how standard deviation works: 1 standard deviation contains 68% of the data, 2 SD (the default for BB) contains 95% of data, 3 SD for 99%, etc. If the data goes past that, it is considered to be outside the distribution. In statistics, data that is within the distribution is considered to be "significant".
The z-score line is colored green if it is above zero and red if it is below zero. Above zero means that the RSI is above the average line or the middle line of the Bollinger Bands, and vice-versa if it is below. A red vertical bar is shown when the the z-score is above the upper border line to show that it is overbought and a green vertical bar is shown when the z-score is below the lower border line to show that it is oversold. This is the equivalent of when the RSI is above and below its Bollinger Bands.
+ BB %B: MA selection, bar coloring, multi-timeframe, and alerts+ %B is, at its simplest, the classic Bollinger Bands %B indicator with a few added bells and whistles.
However, the right combination of bells and whistles will often improve and make a more adaptable indicator.
Classically, Bollinger Bands %B is an indicator that measures volatility, and the momentum and strength of a trend, and/or price movements.
It shows "overbought" and "oversold" spots on a chart, and is also useful for identifying divergences between price and trend (similar to RSI).
With + %B I've added the options to select one or two moving averages, candle coloring, and a host of others.
Let's start with the moving averages:
There are options for two: one faster and one slower. Or combine them how you will, or omit one or both of them entirely.
Here you will find options for SMA, EMA (as well as double and triple), Hull MA, Jurik MA, Least Squares MA, Triangular MA, Volatility Adjusted MA, and Weighted MA.
A moving average essentially helps to define trend by smoothing the noise of movements of the underlying asset, or, in this case, the output of the indicator.
All of these MAs available track this in a different way, and it's up to the trader to figure out which makes most sense to him/her.
MA's, in my opinion, improve the basic %B by providing a clearer picture of what the indicator is actually "seeing", and may be useful for providing entries and exits.
Next up is candle coloring:
I've added the option for this indicator to color candles on the chart based on where the %B is in relation to its upper and lower bounds, and median line.
If the %B is above the median but below the upper bound, candles will be green (showing bullish market structure). If %B is below the median but above the lower bound, candles will be red (denoting bearish market structure).
Overbought and oversold candles will also be colored on the chart, so that a quick glance will tell you whether price action is bullish/bearish or "oversold"/"overbought".
I've also added functionality that enables candles to be colored based on if the %B has crossed up or crossed down the primary moving average.
One example as a way to potentially use these features is if the candles are showing oversold coloration followed by the %B crossing up your moving average coloration. You might consider a long there (or exit a short position if you are short).
And the last couple of tweaks:
You may set the timeframe to whatever you wish, so maybe you're trading on the hourly, but you want to know where the %B is on the 4h chart. You can do that.
The background fill for the indicator is split into bullish and bearish halves. Obviously you may turn the background off, or make it all one color as well.
I've also added alerts, so you may set alerts for "overbought" and "oversold" conditions.
You may also set alerts for %B crossing over or under the primary moving average, or for crossing the median line.
All of these things may be turned on and off. You can pretty much customize this to your heart's delight. I see no reason why anyone would use the standard %B after playing with this.
I am no coder. I had this idea in my head, though, and I made it happen through referencing another indicator I was familiar with, and watching tutorials on YouTube.
Credits:
Firstly, thanks to www.tradingview.com for his brilliant, free tutorials on YouTube.
Secondly, thanks to www.tradingview.com for his beautiful SSL Hybrid indicator (and his clean code) from which I obtained the MAs.
Please enjoy this indicator, and I hope that it serves you well. :)

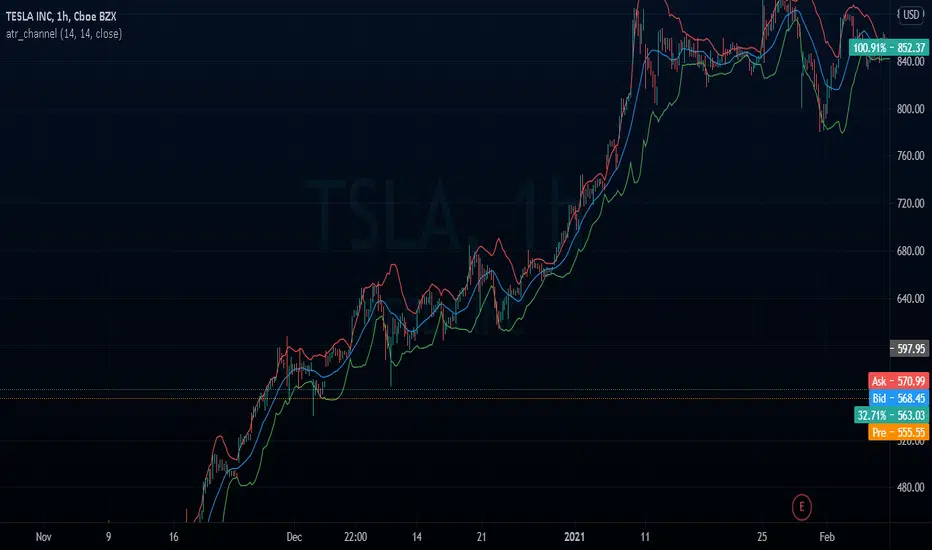
atr_channelThe original bollinger bands have a fixed deviation of 2%, this channel calculates the ATR % (Atr Percentage) and places the upper and lower bands
Cosmic Bands4 Bollinger Band channels with StdDev mult values of 1, 2, 4, and 4.5 (the last value can be changed in the indicator's settings).
Often shows better correlation with the log setting on.

Double BB + Multi Ema Supports 2.0 // by Mochero Use this indicator to identify the market trend, possible dynamic support or resistance, and possible reversals or corrections.
Take the moving averages (50,75,100,200) as a reference to identify whether the market is bullish or bearish.
Use the Parabolic Sar, to identify minor trends.
Take as reference the Moving Averages (5,9,15,25) as possible support or dynamic resistance.
You can also use a DEMA 9.
This indicator marks past Supports and Resistances to have a reference and mark reversal zones.
Take the BB as a reference, to identify possible setbacks or trend changes.
Added a third BB (optional).
-Added 3 types of signals, with RSI, Stoch, DMI. They indicate possible reversals or changes in trends.
Suggested values
-RSI 4
-Stoch 1 (5,1,1)
-Stoch 2 (14,1,1)
-DMI (10, 3)

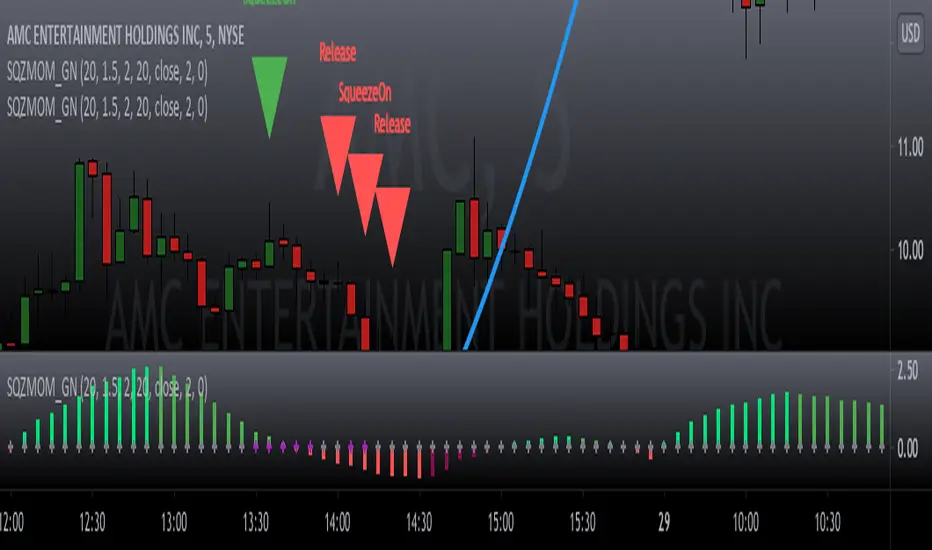
Squeeze Momentum Indicator v4_pine [By Lazy Bear]This is the famous Squeeze Momentum Indicator made by @LazyBear in v4 version if someone wants to test some strategies, as the original code was in v2 version the code converter couldn't convert to v4.

Bollinger Bands With Squeeze [Nic]Bollinger bands with color indicators to detect two key scenarios :
- The squeeze (yellow) detects a potential breakout (or down) in price volatility.
- The extreme overbought / over sold conditions. This happens during a 'band ride'.
"There is nothing more beautiful than when a stock becomes overbought, and stays overbought" - John Bollinger

Multi Band Channel - Oversold/Overbought OscillatorIf your trading strategy is to sell the RIPs and buy the DIPs, this is an indicator for you.
This is based on the multi band indicator present here:
Code is simplified to generate as many bands as possible and hence divide price into as many states as possible based on these bands. Moving Average Type defines what moving average to be considered for Bollinger Band/Keltner Channel. This is based on
Once we derive price state based on multi bollinger band/keltner channel levels, we then look for highest and lowest levels in LoopbackPeriod .
Overbought level = Highest Level - Offset
Oversold level = Lowest Level + Offset
Blue line indicates current state.

Bollinger Bands - Custom moving averageFormula for bollinger bands is as below:
Mid = sma(20)
Top = sma(20) + 2*StdDev(20)
Bottom = sma(20) - 2*StdDev(20)
While standard bollinger bands allow changing standard deviation and length, there is no option to use different moving average.
This indicator allows you to define bollinger bands based on different moving average types which can be selected from input.

Mandelbrot's RangeThis uses a Rescaled Range from Benoit Mandelbrot's Misbehavior of Markets to devise a Risk Range on stocks. A trading position can be managed by selling portions at the top of the risk range and selling at the bottom of the risk range.
The Length parameter defines how wide the range is and how frequently the price will reach the range bands.
The Vol Length Parameter defines how far back to weight volatility, and how responsive the bands will be in response to volatility

Envy's Bollinger Band RSI Strategy - My First ScriptThis is an indicator that prints buy and sell signals based off the conditions that are met and this strategy itself can be really good when used correctly and do not use this when you are looking at news pair or any pairs of high volatility and this can be done through looking at the market research on the forex.com website.
This strategy uses the bollinger bands paired with RSI to determine the possible entries and when these two conditions are met, one final condition will have to be met, which is the overstretched candle, and if these are all met then the entry is valid.
Now before placing an entry if you do decide to use this strategy please follow the steps below:
Recommended Time frame: 5 Minutes
If RSI is higher or equal to 75 -> Look for sells or enter a small position to test the burst of the candle
RSI > 75 and Overstretched -> Placing sells and if the candle builds up then you can have another position that can be greater than the previous if you want to take that risk (No more than 2 or 3)
Take Profit: 5-10 pips downwards
Stop Loss: 10 pips or higher
If RSI is lower or equal to 25 -> Look for buys or enter a small position to test the burst of the candle
RSI < 25 and Overstretched -> Placing buys and if the candle falls down then you can have another position that can be greater than the previous if you want to take that risk (No more than 2 or 3)
Take Profit: 5-10 pips upwards
Stop Loss: 10 pips or higher
Tip: For extra confirmation use the one minute time frame to your leverage, if both the 1 minute and the 5 minute has their RSI to the key levels then it will be a high probability trade!
Note: Do not trade high volatility news events
The time zone to trade in: London Open - New York Closing
The script also provides you with multiple interchangeable settings that can provide you a better picture of trades and reduce noise, however this is my first script so there will be errors that will be listed below!
The dashboard will show you current RSI value, current pair, current timezone, overall trend with the 100MA and the strategy trend with the bollinger band.
Known Bugs:
-Sometimes the signals won't print depending on the bollinger band upper or lower ring and this can be fixed by lowering RSI, changing RSI source output, changing the bollinger band settings etc.
-The print text is constantly recreated after every candle that meets the conditions (mostly appears on news event pairs) and this can be annoying to see and has a lot of noise - noise can be reduced through increasing RSI Source
-The timezone on the dashboard is constantly set to New York for some odd reason

Squeeze Momentum Signal Overlay [GN]Companion script for Squeeze Momentum Indicator that plots the signal on chart.