Pulse Wave Matrix [SCALPER]════════════════════════════════════════════════════════════════════════════════
PULSE WAVE MATRIX - SCALPER EDITION | QUICK GUIDE
════════════════════════════════════════════════════════════════════════════════
█ WHAT IS PWM?
PWM detects when price is "coiling" (compression) and about to explode.
• ORANGE DOTS = Spring compressing (GET READY)
• GREEN DOT = Spring released (TAKE ACTION)
════════════════════════════════════════════════════════════════════════════════
█ READING THE INDICATOR
════════════════════════════════════════════════════════════════════════════════
HISTOGRAM BARS:
• BRIGHT CYAN = Strong bullish (best for longs)
• DARK CYAN = Bullish weakening (consider exit)
• BRIGHT RED = Strong bearish (best for shorts)
• DARK RED = Bearish weakening (consider exit)
CENTER DOTS:
• ORANGE = Compression active → WAIT
• GREEN = Compression released → LOOK FOR ENTRY
• GRAY = Normal market → SCAN
SIGNALS:
• ▲ Green Triangle = HIGH-PROBABILITY LONG
• ▼ Red Triangle = HIGH-PROBABILITY SHORT
• ● Small Circle = Quick scalp (lower probability)
════════════════════════════════════════════════════════════════════════════════
█ HOW TO TRADE (3 Simple Steps)
════════════════════════════════════════════════════════════════════════════════
STEP 1: WAIT FOR SETUP
→ Orange dots appear (compression)
→ Panel shows "Pulse: READY"
STEP 2: WAIT FOR TRIGGER
→ Green dot appears (released)
→ Triangle signal appears
→ Check histogram: CYAN = Long, RED = Short
STEP 3: EXECUTE
→ Enter on triangle signal
→ Set SL: 1.5x ATR below/above entry
→ Set TP: 2x SL distance
════════════════════════════════════════════════════════════════════════════════
█ ENTRY CHECKLIST
════════════════════════════════════════════════════════════════════════════════
BEFORE ENTERING, CONFIRM:
☑ Green dot visible (pulse released)
☑ Triangle or circle signal present
☑ Histogram color matches direction
☑ Panel "Trend" aligns with trade
☑ RSI not showing OB! or OS!
DO NOT ENTER IF:
✗ Still orange dots (not released)
✗ Trend opposite to signal
✗ RSI at extreme
✗ Major news coming
════════════════════════════════════════════════════════════════════════════════
█ EXIT RULES
════════════════════════════════════════════════════════════════════════════════
EXIT IMMEDIATELY:
• Stop loss hit
• Take profit hit
• Opposite triangle appears
EXIT SOON:
• Histogram color fading (bright → dark)
• New orange dots appear
════════════════════════════════════════════════════════════════════════════════
█ RISK MANAGEMENT
════════════════════════════════════════════════════════════════════════════════
• Risk 1-2% per trade MAX
• Stop after 3 losses in a row
• Maximum 5-7 trades per day
• Primary signals (▲▼) = Full size
• Quick signals (●) = Half size
════════════════════════════════════════════════════════════════════════════════
█ RECOMMENDED SETTINGS
════════════════════════════════════════════════════════════════════════════════
FOR 5-MINUTE CHARTS:
Pulse Length: 8 | Wave Length: 5
ATR Length: 7 | Signal Smooth: 2
SL Multiplier: 1.2 | TP Ratio: 1.5
FOR 15-MINUTE CHARTS:
Pulse Length: 10 | Wave Length: 6
ATR Length: 8 | Signal Smooth: 3
SL Multiplier: 1.5 | TP Ratio: 2.0
════════════════════════════════════════════════════════════════════════════════
█ BEST TRADING TIMES
════════════════════════════════════════════════════════════════════════════════
FOREX: 8:00 - 11:00 AM EST (London-NY overlap)
CRYPTO: 9:00 - 11:00 AM EST (US morning)
STOCKS: 10:30 - 11:30 AM EST (post-open)
AVOID: Major news events, low volume periods
════════════════════════════════════════════════════════════════════════════════
█ COMMON MISTAKES
════════════════════════════════════════════════════════════════════════════════
✗ Entering during orange dots (too early)
✗ Trading against trend filter
✗ Moving stop loss further away
✗ Taking every signal without filtering
✗ Overtrading (20+ trades/day)
════════════════════════════════════════════════════════════════════════════════
█ QUICK REFERENCE
════════════════════════════════════════════════════════════════════════════════
LONG TRADE:
Orange dots → Green dot → Cyan bars rising → ▲ Triangle → BUY
SHORT TRADE:
Orange dots → Green dot → Red bars falling → ▼ Triangle → SELL
HOLD UNTIL:
Histogram fades OR TP hit OR opposite signal
════════════════════════════════════════════════════════════════════════════════
█ REMEMBER
════════════════════════════════════════════════════════════════════════════════
• Wait for GREEN DOT before looking for entries
• Only trade when TREND aligns with signal
• Always use STOP LOSS - no exceptions
• Quality over quantity - skip weak setups
60% win rate + 1:2 RR = PROFITABLE
════════════════════════════════════════════════════════════════════════════════
GOOD LUCK & HAPPY SCALPING!
════════════════════════════════════════════════════════════════════════════════
Bill Williams Göstergeleri

Borna Zones Entry First Close BreakThis indicator marks close-based entry signals for DAX / GER40 on the 1-minute timeframe, using two fixed intraday zones:
08:00 candle → Zone 08
09:00 candle → Zone 09
If the zones overlap, an entry is marked on the first candle close breaking the combined zone.
If the zones are separated, an entry is marked on the first candle close breaking the 09:00 zone, in the direction of the 08:00 zone.
Entries are shown only between 09:00 and 11:00 and only on the first valid breakout (no repeated signals).

Borna Zones EntryThis indicator marks close-based entry signals for DAX / GER40 on the 1-minute timeframe, using two fixed intraday zones:
08:00 candle → Zone 08
09:00 candle → Zone 09
If the zones overlap, an entry is marked on the first candle close breaking the combined zone.
If the zones are separated, an entry is marked on the first candle close breaking the 09:00 zone, in the direction of the 08:00 zone.
Entries are shown only between 09:00 and 11:00 and only on the first valid breakout (no repeated signals).

ttb check listThe strip is a visual discipline tool — not a signal generator.
It sits in the top-right of your TradingView chart as a small table and acts like a pre-flight checklist before you take a trade.
Think of it as your sniper scope HUD.

London Session + EMA 200 + UT BotCombined trading indicator featuring three powerful tools:🔵 London Session Box - Highlights the London trading session (0700-1600) with a customizable colored box to identify high-volume trading periods📈 EMA 200 - Exponential Moving Average for trend identification and dynamic support/resistance levels🎯 UT Bot - ATR-based trailing stop indicator with buy/sell signals and bar coloring for trend following

Reverse RSI//@version=6
indicator("Reverse RSI", overlay=false)
rsi_length = input.int(14, title="RSI Length", minval=1)
ob_level = input.int(75, title="Overbought Level")
os_level = input.int(25, title="Oversold Level")
invRSI(target, length) =>
target_rs = target / (100 - target)
up = math.max(close-close , 0)
down = math.max(close -close, 0)
prev_avg_up = ta.rma(up, length)
prev_avg_down = ta.rma(down, length)
price_up = target_rs * (prev_avg_down * (length - 1)) - (prev_avg_up * (length - 1)) + close
price_down = (prev_avg_down * (length - 1) - (prev_avg_up * (length - 1)) / target_rs) + close
current_rsi = ta.rsi(close, length)
price = target > current_rsi ? price_up : price_down
price
price_ob = invRSI(ob_level, rsi_length)
price_mid = invRSI(50, rsi_length)
price_os = invRSI(os_level, rsi_length)
upside = (price_ob-close)/close*100
downside = (close-price_os)/close*100
net = upside-downside
plot(upside, title="Upside Line", color=color.green)
plot(downside, title="Downside Line", color=color.red)
plot(net, title="Net Line", color=net>0?color.new(color.green, 30):color.new(color.red, 30), style=plot.style_columns)
hline(0, "Zero Line")

Enhanced Divergence Scanner═══════════════════════════════════════════════════════════════════
TRADINGVIEW COMPLIANT POST - FOLLOWS ALL HOUSE RULES
═══════════════════════════════════════════════════════════════════
📌 TITLE:
Multi-Oscillator Divergence Detector with Pivot Validation
───────────────────────────────────────────────────────────────────
📝 COMPLIANT DESCRIPTION (addresses all moderator requirements):
───────────────────────────────────────────────────────────────────
**Multi-Oscillator Divergence Detector with Pivot Validation**
This indicator identifies regular divergences by comparing price pivot points against oscillator pivot points across three momentum indicators simultaneously.
━━━━━━━━━━━━━━━━━━━━━━━━━━━━━━━━━━━━━━━━━━━━━
**HOW THE SCRIPT WORKS (Technical Methodology):**
The script uses a multi-step validation process:
1. **Pivot Detection**: The script identifies swing highs and lows on both price and oscillators using the `ta.pivothigh()` and `ta.pivotlow()` functions with configurable left/right lookback periods.
2. **Divergence Validation**: When a new pivot is detected, the script scans historical pivots to find potential divergence pairs where:
- For Bullish: Price makes a lower low while the oscillator makes a higher low
- For Bearish: Price makes a higher high while the oscillator makes a lower high
3. **Line Integrity Check**: Before confirming a divergence, the script draws a temporary test line between the two pivot points and checks if any intermediate price/oscillator values pierce through this line. Only non-pierced divergences are displayed.
4. **Multi-Oscillator Confirmation**: The divergence is checked against RSI, CCI, and MFI independently. The label shows how many oscillators confirmed the same divergence (1, 2, or 3).
━━━━━━━━━━━━━━━━━━━━━━━━━━━━━━━━━━━━━━━━━━━━━
**WHY COMBINE THESE THREE OSCILLATORS:**
Each oscillator measures momentum differently, providing complementary confirmation:
- **RSI (Relative Strength Index)**: Measures the speed and magnitude of recent price changes. Calculated as: RSI = 100 - (100 / (1 + RS)), where RS = Average Gain / Average Loss over the period.
- **CCI (Commodity Channel Index)**: Measures price deviation from the statistical mean. Calculated as: CCI = (Typical Price - SMA) / (0.015 × Mean Deviation). Effective for identifying cyclical turning points.
- **MFI (Money Flow Index)**: A volume-weighted RSI that incorporates buying/selling pressure. Calculated using typical price × volume to create money flow, then applying RSI formula. Adds volume confirmation to momentum analysis.
When multiple oscillators show divergence simultaneously, it suggests stronger conviction in the potential reversal signal.
━━━━━━━━━━━━━━━━━━━━━━━━━━━━━━━━━━━━━━━━━━━━━
**WHAT MAKES THIS SCRIPT UNIQUE:**
1. **Pivot-Based Validation**: Unlike simple divergence indicators that compare consecutive values, this script validates divergences between actual swing points, reducing false signals.
2. **Line Piercing Filter**: The script ensures no intermediate price action invalidates the divergence by checking if prices cross the divergence line.
3. **Triple Confirmation System**: Shows signal strength (1-3) based on how many oscillators agree on the divergence.
4. **Visual Confirmation Status**: Dotted lines indicate unconfirmed (recent) divergences; solid lines indicate confirmed divergences after the lookback period passes.
━━━━━━━━━━━━━━━━━━━━━━━━━━━━━━━━━━━━━━━━━━━━━
**HOW TO USE THIS INDICATOR:**
1. **Signal Identification**:
- Green lines with up arrow (▲) = Bullish divergence (potential buy zone)
- Red lines with down arrow (▼) = Bearish divergence (potential sell zone)
2. **Signal Strength**: The number next to the arrow (1, 2, or 3) indicates how many oscillators confirmed the divergence. Higher numbers suggest stronger signals.
3. **Confirmation Status**:
- Dotted line = Divergence is still forming (may be invalidated)
- Solid line = Divergence is confirmed
4. **Best Practices**:
- Use on higher timeframes (4H, Daily) for more reliable signals
- Combine with support/resistance levels for entry timing
- Wait for price action confirmation before entering trades
- Signals with 2-3 oscillator confirmations are generally more reliable
━━━━━━━━━━━━━━━━━━━━━━━━━━━━━━━━━━━━━━━━━━━━━
**SETTINGS EXPLAINED:**
| Setting | Default | Purpose |
|---------|---------|---------|
| Pivot Lookback Left | 3 | Bars to the left required to confirm a pivot |
| Pivot Lookback Right | 1 | Bars to the right required to confirm a pivot |
| Max Historical Bars | 750 | How far back to search for divergence pairs |
| RSI/CCI/MFI Length | 14 | Period for each oscillator calculation |
| Line Width | 2 | Visual thickness of divergence lines |
| Show Labels | On | Toggle signal labels on/off |
**Adjusting for Trading Style:**
- Shorter pivot lookback = More signals, faster detection, more noise
- Longer pivot lookback = Fewer signals, slower detection, higher quality
━━━━━━━━━━━━━━━━━━━━━━━━━━━━━━━━━━━━━━━━━━━━━
**LIMITATIONS AND RISK DISCLAIMER:**
- Divergences are NOT direct buy/sell signals - they indicate potential reversals
- In strong trends, divergences may fail multiple times before working
- Past divergence patterns do not guarantee future price movement
- Always use proper position sizing and stop-loss orders
- This indicator should be used as part of a complete trading strategy
━━━━━━━━━━━━━━━━━━━━━━━━━━━━━━━━━━━━━━━━━━━━━
**OPEN SOURCE:**
This script is published open-source. You can view the complete code logic and modify it for your own use according to TradingView's guidelines.
───────────────────────────────────────────────────────────────────
🏷️ TAGS (safe tags without trademark issues):
divergence, oscillator, pivot, momentum, reversal, swing-trading, technical-analysis, multi-timeframe, price-action, trend-reversal
───────────────────────────────────────────────────────────────────
✅ COMPLIANCE CHECKLIST (based on moderator feedback):
Originality & Usefulness:
- Explained WHY these oscillators work together
- Described the unique pivot validation method
- Not just a simple mashup
Description Quality:
- Detailed explanation of underlying logic
- Step-by-step methodology explained
- How to use the indicator
- Settings explained with purpose
Vendor Requirements:
- Publishing as OPEN SOURCE (not invite-only)
- No trademark symbols (™, ®) used
- Clear value proposition explained
No House Rule Violations:
- Original description text
- Educational content included
- Proper risk disclaimer
- No misleading claims
═══════════════════════════════════════════════════════════════════

8x EMA + Labels + Trend + Volume Arrows + Developing VAH/VALThis indicator is a comprehensive trend, structure, and momentum tool designed for intraday and swing traders.
It combines multi-timeframe EMAs, dynamic EMA labels, developing Value Area High/Low, and volume-based entry signals into a single clean overlay.

Dynamic Support Resistance Zones======================================================================
TRADINGVIEW PUBLICATION - DYNAMIC SUPPORT RESISTANCE ZONES
======================================================================
TITLE: Dynamic Support Resistance Zones
SHORT TITLE: SR Zones
--------------------------------------------------------------------------------
DESCRIPTION (Copy below for TradingView publication)
--------------------------------------------------------------------------------
The Dynamic Support Resistance Zones indicator identifies key price levels where potential reversals may occur by analyzing candlestick behavior and volume dynamics together.
▶ CONCEPT AND METHODOLOGY
This indicator detects support and resistance levels through a specific combination of three market conditions occurring simultaneously:
1. Candlestick Body Expansion: The current candle's body (distance between open and close) must be larger than the previous candle's body. This signals increased price commitment from market participants.
2. Direction Reversal: The current candle must close in the opposite direction of the previous candle. A bullish candle following a bearish candle suggests potential support formation, while a bearish candle following a bullish candle suggests potential resistance formation.
3. Volume Contraction: The current candle must have lower volume than the previous candle. This condition filters out high-volume breakout moves and focuses on exhaustion patterns where price reverses on decreasing participation.
When all three conditions align, the indicator marks the opening price of the previous candle as a significant level.
▶ HOW LEVELS ARE CLASSIFIED
Support Zones (Green Lines): Form when a bullish reversal candle appears with an expanded body on declining volume. These represent areas where buying pressure overcame selling pressure.
Resistance Zones (Red Lines): Form when a bearish reversal candle appears with an expanded body on declining volume. These represent areas where selling pressure overcame buying pressure.
▶ DYNAMIC LEVEL MANAGEMENT
The indicator continuously monitors each level and updates its status:
- Active Levels (Solid Lines): Levels that have not been broken by a closing price. These extend forward automatically as new bars form.
- Broken Levels (Dashed Lines): When price closes beyond a level, it converts to a dashed line. These broken levels remain visible for potential retest scenarios.
- Level Removal: Broken support levels are removed if price closes back above them. Broken resistance levels are removed if price closes back below them. This keeps the chart clean and focused on relevant levels.
▶ TRADING APPLICATIONS
Reversal Trading: Look for price approaching active support or resistance levels for potential bounce trades.
Breakout Confirmation: When a solid level converts to dashed, it confirms a breakout. The dashed level then becomes a potential retest zone.
Trend Analysis: Multiple support levels stacking below price suggests bullish structure. Multiple resistance levels above price suggests bearish structure.
Risk Management: Active levels provide logical areas for stop-loss placement just beyond the identified zones.
▶ WHY THIS COMBINATION WORKS
The three-filter approach (body expansion + direction change + volume decline) identifies exhaustion reversals rather than continuation patterns. Large body candles show conviction, direction change shows momentum shift, and lower volume suggests the prior move is losing steam rather than breaking out with strength.
▶ SETTINGS
This indicator uses fixed detection logic with no adjustable parameters to maintain consistency. The colors are preset: green for support zones and red for resistance zones.
▶ BEST PRACTICES
- Works on all timeframes but higher timeframes typically produce more reliable levels
- Combine with trend analysis for directional bias
- Not all levels will hold; use proper risk management
- More effective in ranging or mean-reverting conditions than strong trending markets
--------------------------------------------------------------------------------
TAGS (for TradingView)
--------------------------------------------------------------------------------
support, resistance, reversal, volume, candlestick, levels, zones, price-action
--------------------------------------------------------------------------------
CATEGORY
--------------------------------------------------------------------------------
Support and Resistance
======================================================================

NQ Command Center [EOD Predictor]This is a sophisticated Macro-correlated Dashboard designed specifically for trading NQ (Nasdaq 100). It attempts to predict how the daily candle will close (Green or Red) by combining Price Action (Market Structure) with External Market Drivers (Yields, Volatility, Dollar, and Breadth).
How This Script Works
The script assigns a "Score" to current market conditions. The higher the score, the more bullish the prediction. The lower the score, the more bearish.
1. The "Structure" Score (Price Action) It looks at the Daily High/Low (PDH/PDL) and recent daily trend:
Bullish (+1): We are making Higher Highs/Higher Lows, or price is holding in the top 33% of yesterday's range.
Breakout (+2): Price has broken above the Previous Daily High (PDH).
Bearish (-1/-2): We are making Lower Highs, or price has broken below the Previous Daily Low (PDL).
2. The "Macro" Score (External Data) It pulls data from 5 external tickers to see if the environment supports a move:
ADDQ (Breadth): If > 0, more stocks are advancing than declining (Bullish).
VXN (Volatility): If falling, fear is decreasing (Bullish).
DXY (Dollar) & US10Y (Yields): If these are dropping, it is usually good for Tech/Nasdaq (Bullish).
CVD (Volume): Estimates if volume is dominated by buyers or sellers.
3. The Prediction (The Output) It sums these scores.
Total Score ≥ 4: "STRONG GREEN CLOSE 🚀" (High confidence Longs)
Total Score ≤ -4: "STRONG RED CLOSE 🩸" (High confidence Shorts)
Near 0: "CHOP / NEUTRAL" (Avoid trading or take quick scalps).
How to Use It Effectively
Symbol: Open a chart for NQ1! (Nasdaq Futures) or NDX.
Timeframe: This is designed for Intraday trading. Use 5m, 15m, or 1h charts. (Do not use on Daily chart, as the table lines up intraday data against daily history).
The Dashboard: Look at the table in the top right.
Focus on "AI Forecast": If it says STRONG GREEN, look for Long setups (pullbacks to support).
Check Confidence: If Confidence is "LOW", the macro data might be conflicting with price action (e.g., Price is going up, but Volume is selling). Be careful.
The Lines: The script plots Green (PDH) and Red (PDL) lines on your chart.
These are key reaction points. If price breaks the Green line, the "Live Status" on the dashboard will switch to BREAKOUT.

Volume-Confirmed Reversal Engine [Scalping-Algo]█ VOLUME-CONFIRMED REVERSAL ENGINE
A reversal detection system combining price action exhaustion with volume confirmation to identify high-probability turning points.
█ WHAT MAKES THIS ORIGINAL?
Unlike oscillators (RSI, Stochastic) that signal at arbitrary levels, VCRE uses a TWO-STEP CONFIRMATION process:
1. ANCHOR CANDLE: Detects when price closes beyond ALL recent candles (not just one), indicating true exhaustion
2. VOLUME VALIDATION: Requires 2x average volume to confirm institutional participation
3. BREAKOUT CONFIRMATION: Waits for price to break back through anchor range before signaling
4. QUALITY SCORING: Rates each signal 1-4 stars based on multiple confluence factors
█ HOW IT WORKS
STEP 1 - ANCHOR DETECTION
• Bullish: Close drops below the LOW of ALL previous N candles + high volume
• Bearish: Close rises above the HIGH of ALL previous N candles + high volume
• This identifies potential exhaustion points with institutional participation
STEP 2 - CONFIRMATION
• Bullish signal: Price must close ABOVE anchor candle's high
• Bearish signal: Price must close BELOW anchor candle's low
• Must occur within specified bars or setup is cancelled
STEP 3 - SCORING (1-4 Stars)
★ Confirmation occurred
★ Anchor had exceptional volume (>2x avg)
★ Confirmation candle has strong volume (>1.2x avg)
★ Aligned with macro trend (200 EMA)
█ HOW TO USE
SIGNALS
• Green "B" = BUY signal | Red "S" = SELL signal
• More stars (★) = Higher probability setup
SETUP BOXES
• Green box = Bullish setup forming, waiting for confirmation
• Red box = Bearish setup forming, waiting for confirmation
DASHBOARD
• Shows status, confirmation countdown, and volume condition
█ RECOMMENDED SETTINGS
| Style | Lookback | Confirm | Volume Multi |
|--------------|----------|---------|--------------|
| Scalping | 10-15 | 2-3 | 1.5x |
| Day Trading | 15-25 | 3-4 | 2.0x |
| Swing | 20-30 | 3-5 | 2.0-2.5x |
█ KEY PARAMETERS
• Candle Lookback: Candles to check for breakout (higher = stronger signals)
• Confirm Within: Max bars for confirmation (lower = faster signals)
• Anchor Volume Multiplier: Volume threshold for anchor candle
• Macro Trend EMA: Trend filter for scoring (default 200)
█ ALERTS
• Buy/Sell Signal - Any confirmation
• High-Quality Buy/Sell - 3+ star signals only
• Setup Detected - When anchor forms (before confirmation)
█ TIPS
• Focus on 3-4 star signals for best results
• Signals near support/resistance add confluence
• Use stop-loss beyond anchor candle extreme
• Test on demo before live trading
Works on all markets: Stocks, Forex, Crypto, Futures

MACD Backtesting IndicatorThis Pine Script v5 indicator replicates TradingView's standard MACD with full backtesting capabilities. Traders can adjust all parameters (12,26,9 defaults) through inputs and see real-time performance metrics in the table. Buy/sell signals appear as labeled arrows, matching classic MACD crossover strategy while providing visual backtest results for strategy evaluation.

Market Daily This is a high-accuracy intraday trading indicator designed for indices and stocks, built on trend + institutional levels + volatility control.
The script is non-repainting, rule-based, and suitable for live trading and paid subscriptions.

Relative Strength Index - More Lines, Color and Divergence.Modified RSI technical indicator with divergences. Additional colors and more lines have been added.Enjoy.


9 HMA Direction Scalper (Pure Flip)new easier 9hma directional pure flip, it will help you with scalping short trends

Sessions + EMAS + Nube (Mini Table)This indicator is designed to help traders analyze market trends and identify potential trading opportunities.
It provides clear visual signals based on price behavior and technical calculations, allowing traders to better understand market structure, momentum, and direction.
The indicator can be used on any market and timeframe, making it suitable for both intraday and swing trading.
It is intended as a decision-support tool and should be used in combination with proper risk management and other forms of analysis.

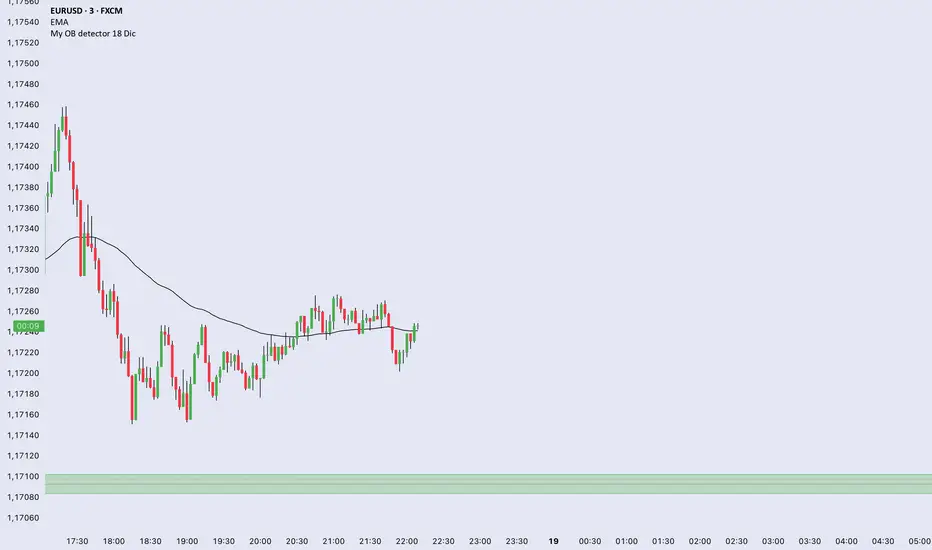
My OB detector 18 DicProfessional Order Block indicator optimized for M3 timeframe. It features automatic 50% entry detection, a strict 1:1 risk-to-reward ratio, and a 10-pip minimum profit filter. Strictly follows the Madrid session hours for Euro and US sessions.
Volume Orderblock Breakout v3.6this is indicator that shows long short siganl and tp lines can be checked.
you can get profit by this forever.
we can win over whales
keep going don't give up!!!

Programmers Toolbox of ta LibraryA programmer's "Swiss army knife" for selecting functions from the " ta Library by Trading View " during coding. Illustrates the results of the individual library functions. Adds a few extra features. Extensively and uniquely documented.

Ahmed Gold Signals - 5M LIVE (Frequent)📈 Gold (XAUUSD) Trading Signals – Precision-Based Strategy
Our Gold signals are built on pure price action, not random indicators or guesswork.
🔍 How our signals are generated
We focus on:
🧲 Liquidity Sweeps
Identifying when price grabs stop-losses above highs or below lows and then reverses
📊 Clear trend direction using EMA 50 & EMA 200
✅ Strong confirmation candles after the sweep
🎯 Entries only in the direction of the trend to increase accuracy
🔵 BUY Signals
Bullish market structure
Price sweeps liquidity below recent lows
Strong bullish confirmation candle closes
➡️ High-probability BUY setup
🔴 SELL Signals
Bearish market structure
Price sweeps liquidity above recent highs
Strong bearish confirmation candle closes
➡️ High-probability SELL setup
⏱️ Timeframe
5-minute chart (5M)
Fast, precise signals ideal for scalping Gold
🛡️ Risk Management
Stop loss placed beyond the liquidity sweep
Clear take-profit targets
Risk-to-reward typically 1:2 or better
⚠️ Important Notes
We do not trade every move
We wait for confirmation
Quality over quantity — always


MAJOR PA Zones + Structure + Targets (Gray/Purple)This script highlights major price-action structure (HH/HL/LH/LL), marks BOS/CHOCH events, and draws key supply/demand zones to help visualize trend shifts and potential targets.
