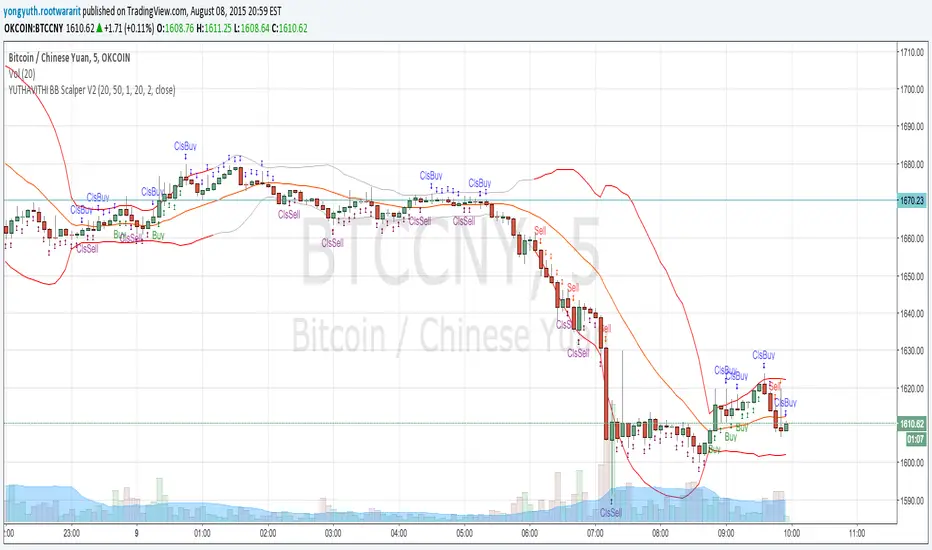
5 Bollinger Bands in levels 50,2.0 | 50,2.5 |50,3.0 |50,3.5 |50,4.0 This is used to identify pullbakcs and future pitchfork's.
Plot where RSI or MFI is in its Bollinger Bands . Can be used in many different way: as a trend indicator (above below 0.5), part of a trend following strategy when crossing above 0 (resume bullish trend ) or crossing below 1 (resume bearish trend ), also useful for divergences, etc...
Edited version of the script by LazyBear. Update of my previous script. Features: - plot both MFI and/or RSI (LazyBear only allows one of both) - plot RSI/MFI band (over sold - mid - over bought) + indicator lines
Edited version of the script by LazyBear. Update of my previous script. Features: - plot both MFI and/or RSI (LazyBear only allows one of both) - plot an indicator band (over sold - mid - over bought)
This script is a mix of both the default Bollinger Bands and the default Keltner Channels. It helps in identifying the squeeze of the bands and also the consolidation of the price movement.
This is a combination of 8 Moving Average & 1 BB for comfortable use. 이것은 조합이다. 8개 이동평균선 & 1개 볼린저밴드. 편하게 사용.
HELLO EVERYONE ! I created this indicator to simplify my life in the study of the bollinger bands on a multi-time frame optics. It works exactly like the bollinger bands %B you have of defaul inside tradingwiew; BUT you can choose via an integrated button that I integrated if you see the indicator on the chart timeframe or a custom time frame, which can be...
Hello everyone , I want to share with the comunity my work for look BB %B in a different timeframe without having to change it every time. I had done to look and study different or multi timeframe a BB %B I have programmed the script so that it is completely identical to the default one of tradingwiew to simplify its use at all. I hope this work can be useful...
Flexible Fibonacci Bollinger Bands Colorful 3d Bands displaying Support and Resistance areas based off of Fibonacci Ratios in a customization Bollinger Band. Choose from vary types of moving average types to get the perfect fit for your trade style. MA Types Available - SMA - SMMA - EMA - DEMA - TEMA - HULL-MA - WMA - VWMA You can purchase access to this...
This is the updated Version of the ProfitTrailerV2 RSI+BB+StochRSI+Stochastic Oscillator Signal+Alerts Description This is an all-in-one indicator with alerts that most people call signals and it's designed for Cryptocurrency leverage trading. This indicator features, the most popularly used indicators in technical analysis and are the basic technical analysis...
Description This is an indicator with alerts/signals and it's designed for Cryptocurrency leverage trading (scalping). This indicator features, the most popularly used indicators in technical analysis and that is the Bollinger Bands and Relative Strenght Index (RSI). The CryptoScalper's RSI+BB Signal+Alerts was designed for use with ProfitTrailer V2 and can also...
Proprietary indicator of DMTrading. The Vol. cycle aims to detect BB phase 1.
it is simple script. it just use 2 BB. and also it show arrow when candle touch upper(or lower) line. ( one person asked me to make this script. this is not my idea. ) i hope you change values by yourself. ---- 한국어 설명 2개의 볼린저 밴드를 사용하는 지표입니다. 특별히 독착정인 수식이나 기법은 없지만 2개의 볼밴을 하나의 스크립트에서 사용할 수 있습니다. 그리고 볼밴 위나 아래를 돌파하면 화살표를 보여주어서 편합니다. ( 한분의 요청으로 개발하였으며 저의 아이디어가...
Five indicators in one. 4 Moving Average Exponential : 8, 13, 21, 55 - as per @Philakone strategy Bollinger Bands Check out my other scripts for RSI and Stoch RSI all in one, and 4EMA + Death Cross + Bollinger Bands.
Hello and welcome to my 2-in-1 indicator of Volatility Profit Indicator and Bollinger Bands. Volatility Profit Indicator is a script inspired by Jim Berg, from a 2005 article titled "The Truth About Volatility". This is a set of bands, where the upper band is based on a moving average of highs over a given period, added to the average true range of the period....
basically allowing me to just have one indicator for my bb monday and emas