4EMA (8,13,21,55) + Bollinger BandsFive indicators in one.
4 Moving Average Exponential : 8, 13, 21, 55 - as per @Philakone strategy
Bollinger Bands
Check out my other scripts for RSI and Stoch RSI all in one, and 4EMA + Death Cross + Bollinger Bands.
BB

Volatility Profit (VPI) & Bollinger Bands (BB) [checkm8]Hello and welcome to my 2-in-1 indicator of Volatility Profit Indicator and Bollinger Bands.
Volatility Profit Indicator is a script inspired by Jim Berg, from a 2005 article titled "The Truth About Volatility". This is a set of bands, where the upper band is based on a moving average of highs over a given period, added to the average true range of the period. The lower band is based on a moving average of lows over the same given period, from which the average true range is subtracted. The formula is shown below:
VPI High Band = MA(HI, type, x) + y * ATR(z)
VPI Low Band = MA(LO, type, x) - y * ATR(z)
where... type = MA Type (default to Exponential) x = MA Period (default to 13) y = True Range Multiplier (default to 2) z = True Range Period (default to 20)
Bollinger Bands should be familiar by now, but they are calculated based on a moving average of a source ( / 3), added to a particular standard deviation of the source.
This indicator:
- Allows you to choose whether you want to plot the Volatility Profit Indicator or Bollinger Bands. By default, each will show three bands.
- Has pre-made color schemes to choose from to simplify your life.
- Has smoothing for the Volatility Profit Indicator
- Allows you to choose the source for Bollinger Bands
- Allows you to select what multiplier of the average true range the Volatility Profit Indicator plots, as well as what standard deviations the Bollinger Bands show.
If you have any additional questions, concerns, or suggestions - feel free to reach out.
All the best & happy trading.

Squeeze CMF IndicatorI changed the indicator code of Lazybear to replace the linreg with the Chaikin money flow. I recommend using a Macd because the chaikin money flow can give false signals, like any other indicator.

VWMA Bollinger BandsHey there fellow bollinger band fans!
The main point of this script is to give bollinger bands with a vwma basis rather than a sma basis. It is important to note that the default setting is to average the opening price rather than closing price of previous candles (just my personal preference). Also by default this script shows bands based on one, two and three standard deviations from the vwma basis. Play with the settings and change them to what you like.

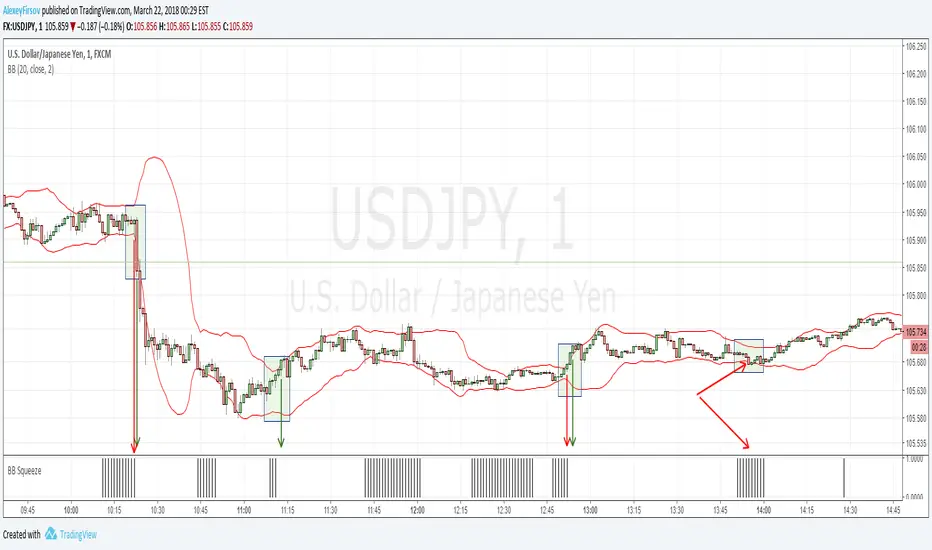
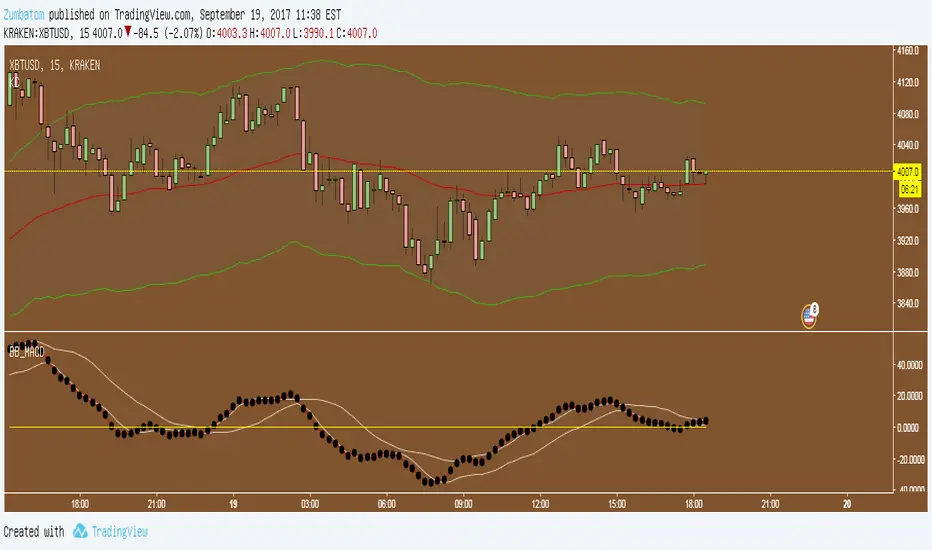
Bollinger Bands SqueezeEnglish:
Simple histogram, showing Squeeze of Bollinger Bands.
Usage is simple - when price is in Squeeze, no entries in any direction. For using with Bollinger Bands indicator, including binary options.
Russian
Простой индикатор, наглядной отображающий стадию Сжатия лент Боллинджера.
Простой в использовании - когда цена в Сжатии - не входим в сделку. Особенно эффективен при связке с индикатором лент Боллинджера и входе в сделку при раскрытии лент. Также применим для бинарных опционов
Example/Пример
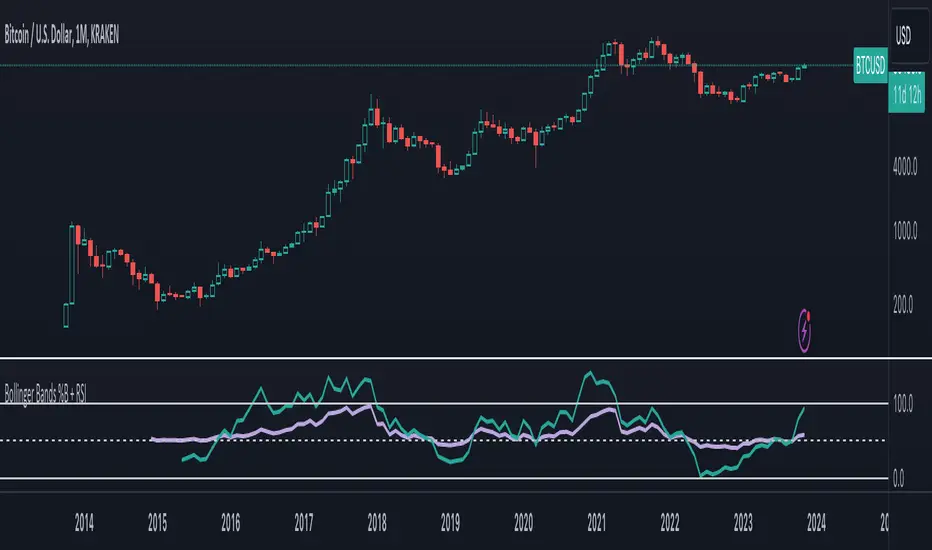
Bollinger Bands %B + RSIBollinger Bands %b and RSI in one, and a experimental RSI cloud based in BB formula.
RSI scale goes from 0.00-1.00 instead of 0 -100.
EMA Bollinger Bands w/ Breakout Signals (EMA BBs)EMA Bollinger Bands with Signals When Price Exits Either Top or Bottom Bollinger Bands (Marked with either Red or Blue Triangles) (EMA BBs)
EMA BBs work even better for day trading and scalping!
These are Multi Bands,
P.S. Sorry Chart Pictured is a mess Ichimoku Cloud is Turned On
This indicator is Bollinger Bands Only w/ Signals of price exiting of bands

All indicators in one!All indicators in one!
Hull MA (2 colors) + Bollinger Bands + 6 EMA + 50 SMA + 200 SMA + Parabolic SAR + SUPER TREND (2 colors) + Doji signals (yellow)
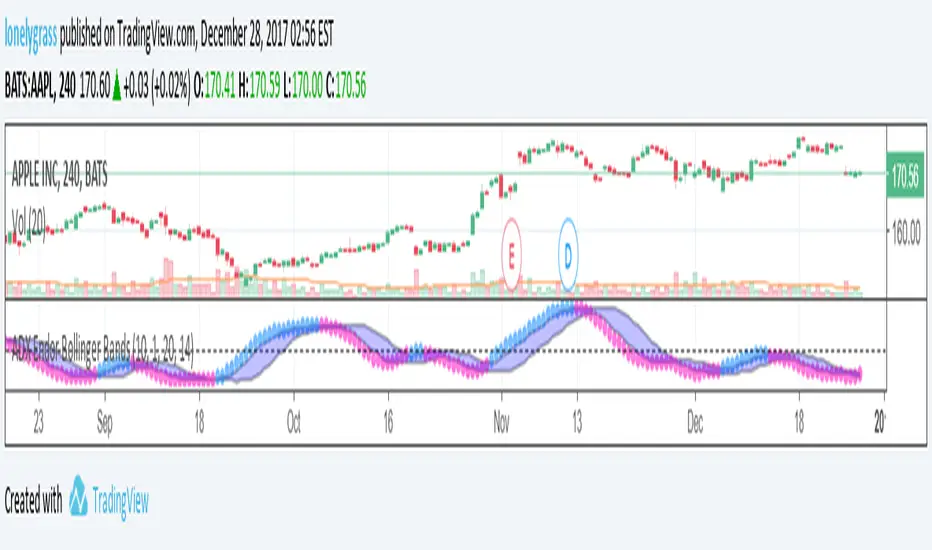
ADX Endor Bollinger BandsThis is a modified version of ADX , and it has a bollinger bands endorsed. An advantage of the indicator is allowing users to capture short term rise or drop of trend strength, particularly useful for scalping.
There are three modes open to users: ADX, DIPlus and DIMinus. Users can simply choose the indicators in their favor. A breach of the upper bollinger band will be in blue, breaching lower band or inside-the-bands signals are painted in pink.
Hope you will enjoy it. Make sure to follow my trading journal and give a thumb up to this post.
Gunbot Deluxe TunersThis script combines all of the other Gunbot tuners along with Okkie's mode into a complete all in one simulation of Gunbot with the ability to mix and match buy and sell strategies of any combination.
No public requests or donations for access to this script will be granted. Anyone interested in obtaining this script must contact me privately either here or preferably through Telegram. No exceptions.
NOTICE: By requesting access to this script you acknowledge that you have read and understood that this is for research purposes only and I am not responsible for any financial losses you may incur by using this script!

GunbotXT BB-RSISimulation of GunbotXT BB-RSI strategy useful for fine tuning settings and backtesting.
In Pine Editor -> Open "GunbotXT BB-RSI" -> Add To Chart -> On Indicator -> Format -> Input your desired settings to test.
Yellow = Bollinger Bands
Red = High BB (Sell)
Green = Low BB (Buy)
You will not see the RSI on the chart, you need to (and should) add 2nd indicator "Relative Strength Indicator" so that you can visually see how it is being used in the tuner. If you change the RSI 70/30 numbers in the tuner then change them also in the RSI 2nd indicator that you added below the tuner so that they visually match what is going on behind the scenes in the tuner.
NOTICE: By requesting access to this script you acknowledge that you have read and understood that this is for research purposes only and I am not responsible for any financial losses you may incur by using this script!

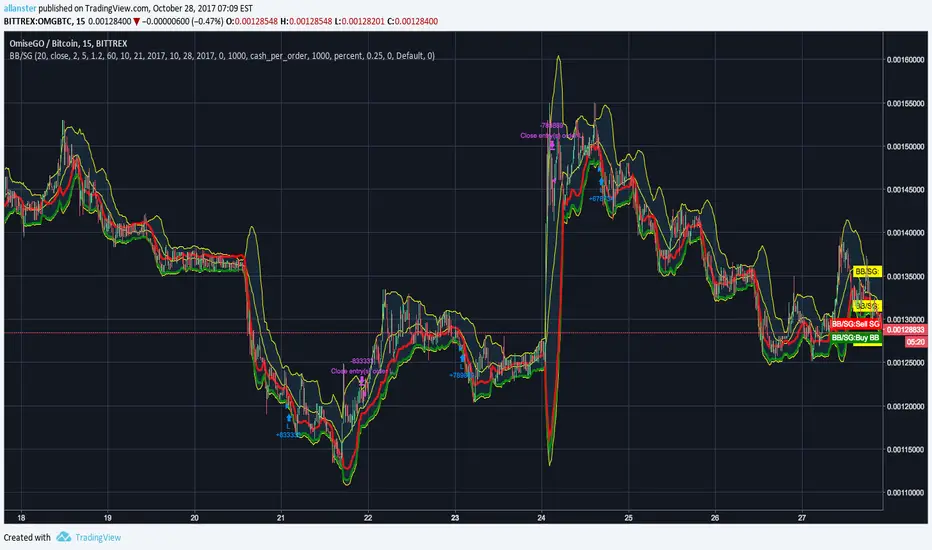
Gunbot BB StepGain TunerSimulation of Gunbot BB Stepgain strategy useful for fine tuning settings and backtesting.
In Pine Editor -> Open "Gunbot BB Stepgain" -> Add To Chart -> On Indicator -> Format -> Input your desired settings to test.
Red = Stepgain Sell Level
Green = BB Buy Level
NOTICE: By requesting access to this script you acknowledge that you have read and understood that this is for research purposes only and I am not responsible for any financial losses you may incur by using this script!
Gunbot BB TunerGunbot BB Tuner
Simulation of Gunbot Pure BB strategy useful for fine tuning settings and backtesting. Set chart period (5min, 15min, etc...) to match what you will enter as period in strategy.
In Pine Editor -> Open "Gunbot BB Tuner" -> Add To Chart -> On Indicator -> Format -> Input your desired settings to test.
Yellow = Bollinger Bands
Red = High BB (Sell)
Green = Low BB (Buy)
NOTICE: By requesting access to this script you acknowledge that you have read and understood that this is for research purposes only and I am not responsible for any financial losses you may incur by using this script!

Gunbot BB - Dmitrovic v1.0Gunbot script made based on bollinger bands.
Currently backtesting in v1.0.

BlackCompositIndicator4OverlayThis is not new indicator.
// Candle Patterns Indicator created by Robert N. 030715
// Volume Indicator @author LazyBear
// Updated and translated by Blyayshman
Это не новый индикатор - это компиляция нескольких для удобства одновременного отображения и экономии разрешенных индикаторов.
Эта версия для отображения на главном экране, вместе с графиком.
Можно отобразить до 4-х MA, 2-х EMA и анализатор паттернов японских свечей.
Пожелания и предложения приветствуются.
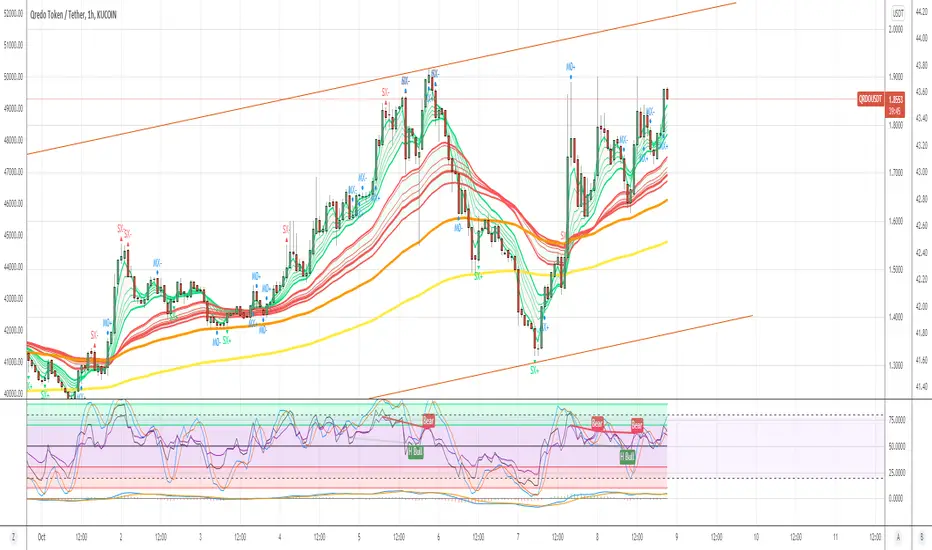
MoD_v1_StochRSISMA_Strategy_Iteration1combines StochRSI, RSI, SMA and BB to find best reversal entries. Also has options for finding Divergence (TBC in Version 2 :-) )


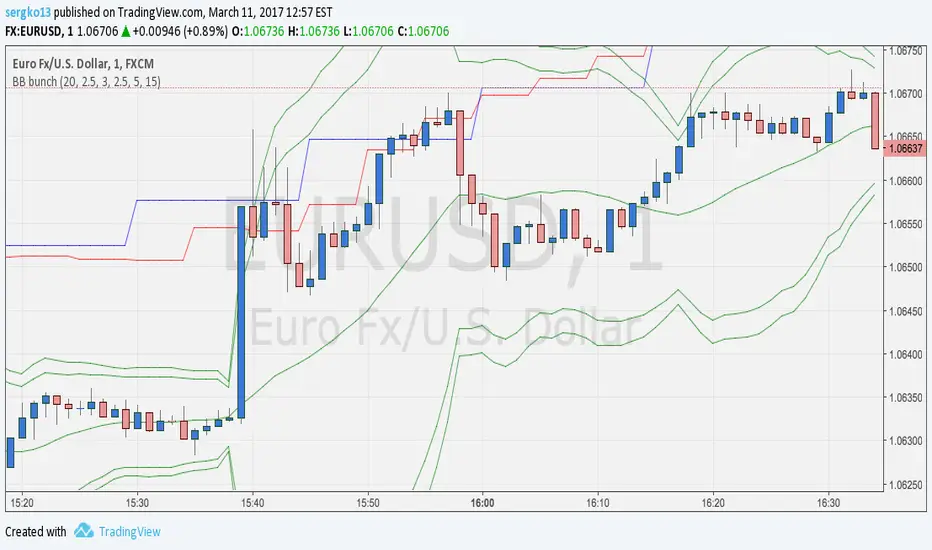
BB bunchThis script draws two Bollinger Bands for current period and bands for two different periods

Single SMA cross with BB StrategyThis is a light weight code and strategy. I tuned it for NZDUSD on a 15 min chart. NZDUSD is a slow moving low volatility pair. A single SMA cross over + crossing a .9 BB + the single SMA is increasing. I will be manually trading this with alerts and once I have LUA down I will set it free with FXCM and see what it can do on it own.
** I use BB as a means of seeing momentum to continue gaining not as a reversal signal.
Please contact me with issues/questions

Chauvenet RadiusThe Chauvenet criterion is a well-known criterion of selection and rejection of the data used by the Physics. It establishes that in an experiment is well to discard the data whose distance from the average is greater than a certain number of the delta.
In the stock market if prices move away from the average with a volatility too high are suspect. This principle is embodied in the Chauvenet floor with the definition of two asymptotes and two data areas rejection.
The Chauvenet Radius is the quadratic sum of the delta (distance from average) and sigmoid (volatility) and is therefore an obvious market stability index. In fact the moments when price strongly moves away from the average with high volatility coincide with the moments of high instability of the market.
It can be considered an evolution of John Bollinger method introduced during the '80.
Source: www.performancetrading.it
yuthavithi BB Scalper 2 strategyIf you are searching a high win rate strategy with good profit factor ratio strategy. this one may be your choice.
Designed to be used with BTC or LTC. with 5 minute time frame or less. This BB strategy achieve win rate over 50% easily, with some tuning you can get even 60%+.
