ATR with Take and StopThis simple indicator will plot the take profit and stop loss values based on the ATR indicator.
It's possible to set how many times the ATR value will be applied to the closing price and
what trade type is used, Long or Short.
Ortalama Gerçek Aralık (ATR)

[CP]ATR Triple Stop Loss LevelsATR based Triple Stop Loss levels that are plotted on the chart (like moving averages!).
With ATR Levels plotted on the price chart itself, you can better set your volatility based trailing Stop Loss.
Also helps to define the SL when making an entry into a stock.
Note:
This indicator is supposed to be used on Daily and Weekly Charts.
For other timeframes you would need to tweek the default parameters.

Average True Range 3MAClassic ATR (average true range) with triple MA (instead of default simple MA).
Specially designed for options volatility management.

Kalihari_Brothers_PRBBasic principle support ,resistance and flipping of support n resistance (support becomes resistance ,resistance becomes support)..
DRB- Previous Day Range High ( PDH ) and Low ( PDL )
WRB- Previous Week Range High (PWH) and Low (PWL)
MRB - Previous Monthly Range High (PMH) and Low (PML)
It gives Trending Market Signal for bullish (price breaks PDH range continuous in up direction and make support)
and similarly for bearish (price breaks PDL range continuous in down direction and make resistance)..
For sideways/Non-trending market stay with in a range not break high and low..(stay away from it)..
DRB act as minor support and resistance ..
WRB and MRB act as major support and resistance ...

[HM] HORIZONTAL GRID ROUNDED (VOLATILITY BASED)The purpose of this indicator is to draw a horizontal grid having in mind:
- rounded price levels instead tradingview standard grid, zoom-based;
- calculated by volatility, using daily ATR;
- independent of timeframe in use, locked to DAILY calculations.
Further improvements are intended.
Wish this could be useful. Any questions, feel free to comment.
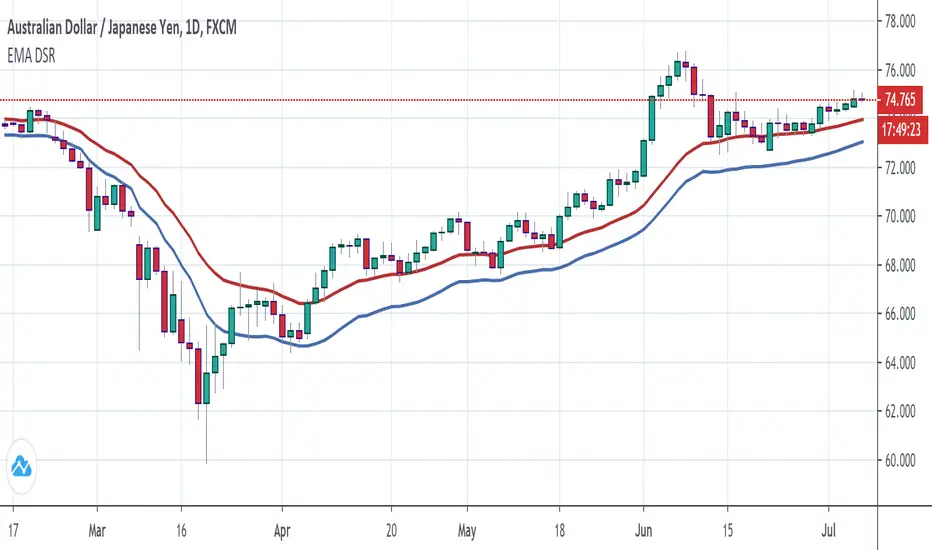
Moving Average ChannelThis indicator will use a moving average to create the channel around the price. It has some settings
Display Settings
Here it's possible to select what the indicator will display, from the middle line to the 3rd band level.
Reversion points will appear when the price cross out the selected band
Swing back option, when active, will make the indicator display the points when the price cross in the selected band
Moving Averages Settings
Here it's possible to select the moving averages settings that will be the basis for the channel calculation.
There are ten moving averages types t be selected, each one will give different entry points
Level Settings
Each level will apply the value on the moving average to get the level bands. All default numbers are from the Fibonacci sequence
When the extra filter is market, the indicator will display the crosses from the price and the selected band and also check if the candle closes in or out the bands.
That filter will check for a possible rejection of the price, providing more accurate movement indications, but fewer signals
Risk Management
In this part, it's possible to display stop loss and target profit levels based on the ATR indicator.
It's possible to select the multiplicator of the ATR to be applied on those levels

MultiType Shifting Predictive Moving Averages (MA) CrossoverJust 2 Moving Averages with adjustable settings and shifting capability, plus signals and predicting continuations.
At the time of publish these different types of MAs are supported:
- SMA (Simple)
- EMA (Exponential)
- DEMA (Double Exponential)
- TEMA (Triple Exponential)
- RMA (Adjusted Exponential)
- WMA (Weighted)
- VWMA (Volume Weighted)
- SWMA (Symmetrically Weighted)
- HMA (Hull)
I'm looking forward to any idea about filtering the signals. Thanks.

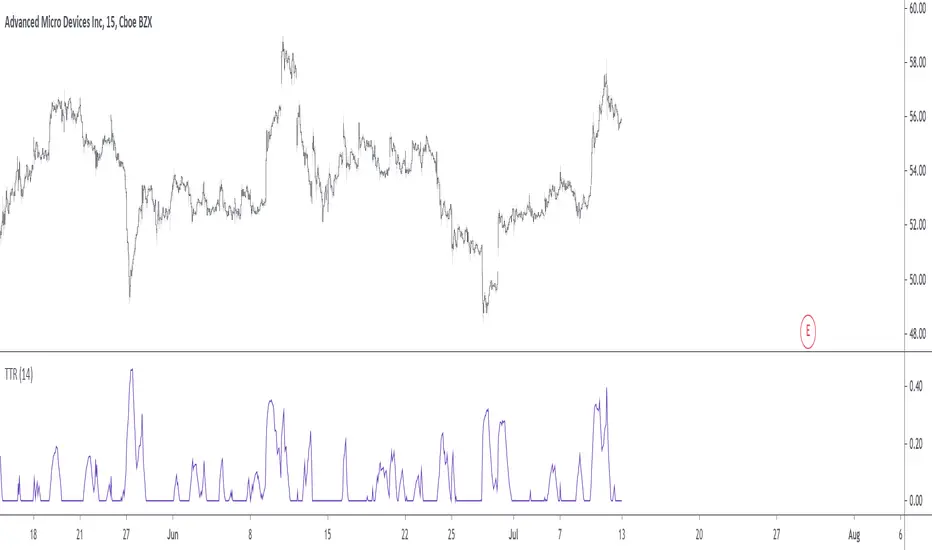
Trending True RangeDisplay a smoothed true range during trending markets, thus filtering any measurement occurring during ranging markets. Whether the market is trending or ranging is determined by the position of the efficiency ratio relative to its Wilder moving average.
Settings
Resolution : resolution of the indicator
Length : period of the efficiency ratio and the Wilder moving averages used in the script
Usage
If you are not interested in volatility during ranging markets, this indicator might result useful to you. An interesting aspect is that it both measures volatility, but also determine whether the market is trending or ranging, with a zero value indicating a ranging market.
Indicator against Atr, with both length = 14, our indicator might be easier to interpret.
Note
Thx to my twitter followers for their suggestions regarding this indicator. I apologize if it's a bit short, the original code was longer and included more options, but forcing a script to be lengthy is a really bad idea, so I stayed with something less flashy but certainly more practical, "classic Grover" some might say.
Thx for reading!
Triple Average True Range Channel Definition: By ADAM HAYES from Investopedia -- Updated Jul 8, 2019
The average true range (ATR) is a technical analysis indicator that measures market volatility by decomposing the entire range of an asset price for that period. Specifically, ATR is a measure of volatility introduced by market technician J. Welles Wilder Jr. in his book, "New Concepts in Technical Trading Systems."
The true range indicator is taken as the greatest of the following: current high less the current low; the absolute value of the current high less the previous close; and the absolute value of the current low less the previous close. The average true range is then a moving average, generally using 14 days, of the true ranges.
I've added a channel perspective from a certain % from the Slow Average Length that user will have to configure depending of resolution and the markets instruments they chose...
Also a fill is used to easily point out when a high distance between a fast and a slow volatility analysis is occurring.
Which is also denotated with a shaped label...
Share and comment my work :)

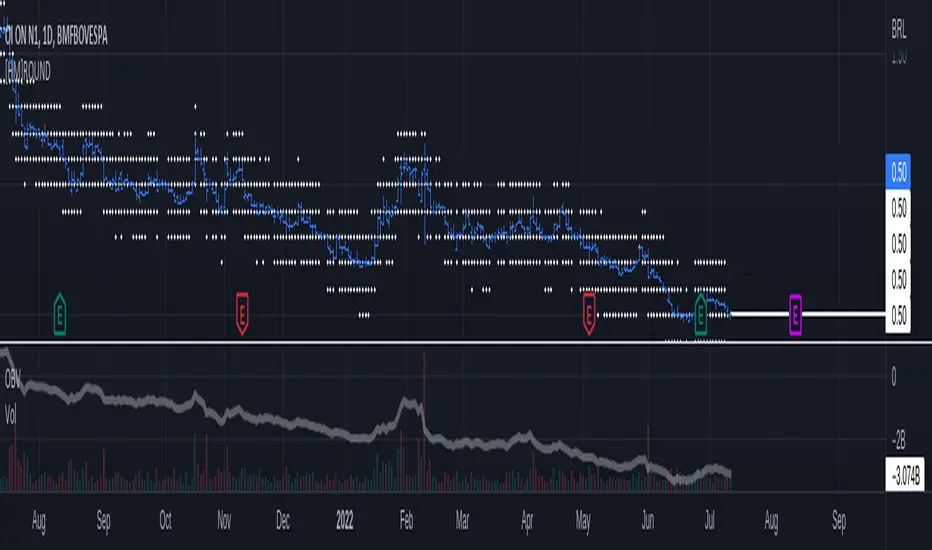
STreme TrialThis indicator plot area to Buy and Sell based on Supply Demand method.
Only works in Weekly timeframe and above.
I used this to help me find the best possible turning point.

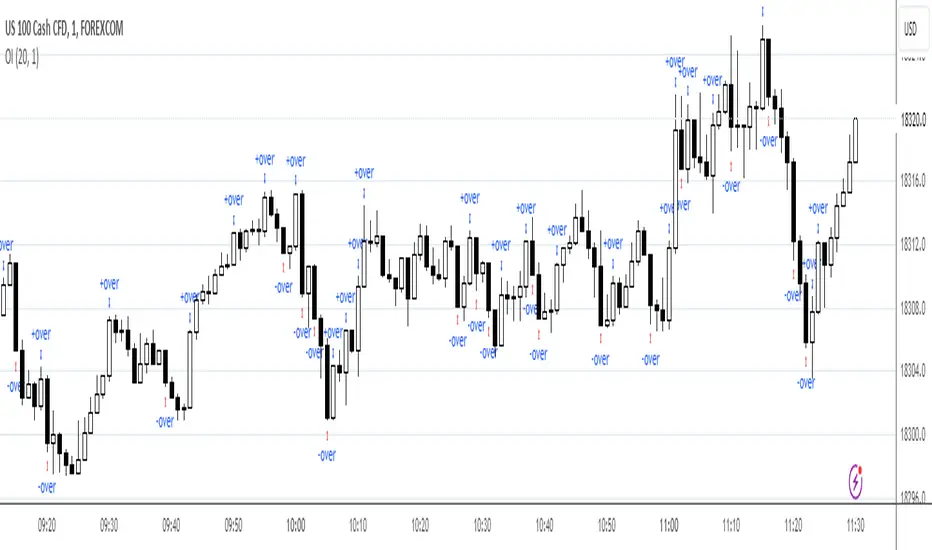
Overreaction indicator
Overreaction Indicator (OI)
Class : overreaction indicator
Trading type : intraday trading
Time frame : 1 day
Purpose : momentum/contrarian trading
Level of aggressiveness : standard
Overreaction Indicator is designed for intraday trading purposes. The indicator is based on the Overreaction Hypothesis. According to this hypothesis, after an abnormally strong rise/fall in price, the next day the contrarian price movement follows.
There are statistically significant differences between intraday dynamics on days with abnormal price changes and normal days respectively.
There is a strong momentum effect on days with abnormal price changes, i.e. prices tend to change only in the direction of the abnormal price changes during the whole day; in addition, usually the presence of an abnormal price movements becomes clear at the start of the US trading session.
During the Asian trading session a strong contrarian pattern is present (i.e., on the day after the overreaction prices tend to go in the opposite direction). Contrarian movement is limited in time, since usually it lasts only till the start of the European session.
There exist trading strategies that generate abnormal profits by exploiting the detected anomalies.
This indicator applies a dynamic trigger approach to detect daily abnormal price changes.
The indicator displays moments of market overreaction directly on the chart.
Parameters of the indicator
1. Averaging period (default value = 20) - period of indicator. It is used to define normal returns.
2. Number of Sigmas (number of standard deviations, default = 2) - Is used to detect abnormal returns. It defines levels of aggressiveness in trading signals. The bigger the value is the more conservative signals are generated
For the further information including the access to the indicator, please write in PM (private messages).
MASTC (Moving Average & Supertrend Cloud)MASTC:- Moving Average & Supertrend Cloud
This MASTC indicator is a combination of Moving Average & Supertrend with default value of 10 & 10,3.
SuperTrend is one of the most common ATR based trailing stop indicators.
A simple moving average ( SMA ) is an arithmetic moving average calculated by adding recent prices and then dividing that by the number of time periods in the calculation average
The buy and sell signals are generated when the indicator starts plotting either on top of the closing price or below the closing price. A buy signal is generated when the ‘Supertrend’ closes above the price and a sell signal is generated when it closes below the closing price.
It also suggests that the trend is shifting from descending mode to ascending mode. Contrary to this, when a ‘Supertrend’ closes above the price, it generates a sell signal as the colour of the indicator changes into red.

RSI Pullback Trend Trading Indicator (LONG Only)***Use at your own risk***
***This is for testing and education only***
I suggest that you also manually add the RSI(5,3,3) on your main chart for analysis.
You can change the settings, but these are the defaults:
Default Main Timeframe = Daily
Default Secondary TimeFrame = Weekly (use around 5X your main timeframe, to check the longer term trend)
Default Stochastic settings ( 5, 3 , 3)
Default Fast EMA : 13
Default Slow EMA : 22
Default ATR : 14
Conditions to show buying signal on main TimeFrame. (Yellow Triangle)
- Check if the MACD Histogram is rising on the secondary timeframe.
- Check if the Stochastic on the main timeframe is below 20.
When deciding to buy, you can use the ATR channels to determine the stop loss and profit target.

ATR & Price Action IndicatorHello there.
This Script prints multiple Entries based on Price Action and ATR.
Can be used on all timeframes.
Kind regrads
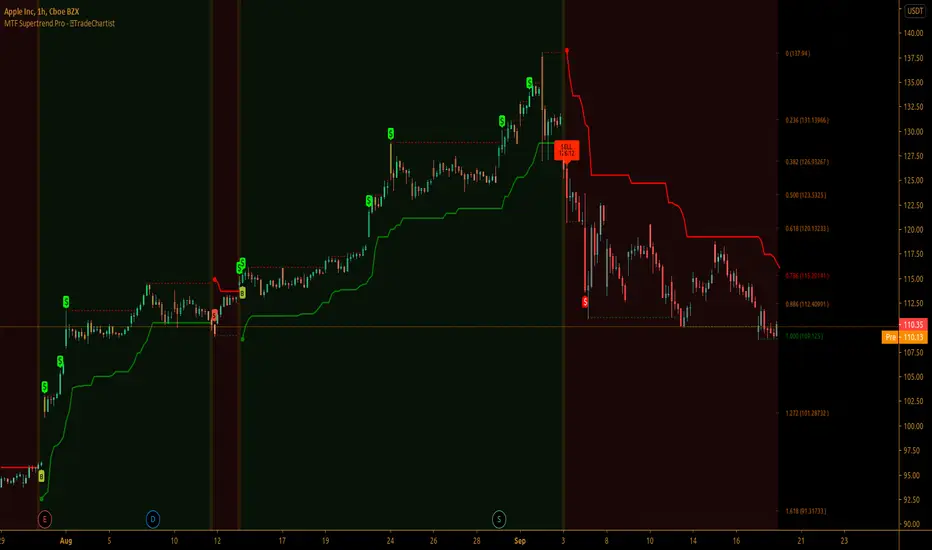
TradeChartist MTF Supertrend Pro™TradeChartist MTF SuperTrend Pro is the Multi Time-Frame version (using timeframe multiplier) of classic Volatility Stop or SuperTrend (Stop and Reverse indicator using multiple of Average True Range of lookback period trailing behind the price acting as both trend reversal signifier and StopLoss trigger at the same time ).
What does ™TradeChartist MTF SuperTrend Pro include?
Multi Time-Frame option using Time-Frame Multiplier to plot Higher Time Frame SuperTrend plot on Lower Time-Frame chart.
Auto-fibs - 2 types (1. Retracement from last significant high/low to previous significant low/high, 2. Retracement from Current High/Low to previous significant Low/High).
Trend identifying color bars.
Trend identifying Background colour.
Option to detect bars where Profit Taking is recommended using $ sign.
How to create Alerts for ™TradeChartist MTF SuperTrend Pro Long and Short Entries?
Alerts can be created for Long or Short entries using Once Per Bar as BUY and SELL labels appear with entries only on confirmation after bar close.
Does the indicator include Stop Loss and Take Profit plots?
This script doesn't have Stop Loss and Take Profit plots, but it can be connected to TradeChartist Plug and Trade as Non-Oscillatory signal to generate Automatic Targets, user set StopLoss and Take Profit plots and to create all types of alerts too.
Does this indicator repaint?
No. This script doesn't repaint as it confirms its signals only after close above/below SuperTrend plot and also uses security function to call higher time-frame values in the right way to avoid repainting. This can be verified using Bar Replay to check if the plots and fills stay in the same bar in real time as the Bar Replay.
===================================================================================================================
Tip 1: Using 1.618 as Timeframe Multiplier results in lucrative trades on most timeframes with ATR multiplier 1.618, 2.618 or 3.618. (Best Practice: Test with various values first on asset using Paper Trades before trading with real money)
Tip 2: Using bars, candles with no borders or Hollow Candles results in clear trend spotting with Bar color option enabled in settings.
===================================================================================================================
Chart below shows Performance of MTF SuperTrend Pro connected to Plug and Trade using Default settings.
===================================================================================================================
This is not a free to use indicator. Get in touch with me (PM me directly if you would like trial access to test the indicator)
Premium Scripts - Trial access and Information
Trial access offered on all Premium scripts.
PM me directly to request trial access to the scripts or for more information.
===================================================================================================================