Trendlines & SR ZonesIt's a comprehensive indicator (Pine Script v6) that represents two powerful technical analysis tools: automatic trendline detection based on pivot points and volume delta analysis with support/resistance zone identification. This overlay indicator helps traders identify potential trend directions and key price levels where significant buying or selling pressure has occurred.
Features: =
1. Price Trendlines
The indicator automatically identifies and draws trendlines based on pivot points, creating dynamic support and resistance levels.
Key Components:
Pivot Detection: Uses configurable left and right bars to identify significant pivot highs and lows
Trendline Filtering: Only draws downward-sloping resistance trendlines and upward-sloping support trendlines
Zone Creation: Creates filled zones around trendlines based on average price volatility
Automatic Management: Maintains only the 3 most recent significant trendlines to avoid chart clutter
Customization Options:
Left/Right Bars for Pivot: Adjust sensitivity of pivot detection (default: 10 bars each side)
Extension Length: Control how far trendlines extend past the second pivot (default: 50 bars)
Average Body Periods: Set the lookback period for volatility calculation (default: 100)
Tolerance Multiplier: Adjust the width of the trendline zones (default: 1.0)
Color Customization: Separate colors for high (resistance) and low (support) trendlines and their fills
2. Volume Delta % Bars
The indicator analyzes volume distribution across price levels to identify significant supply and demand zones.
Key Components:
Volume Profile Analysis: Divides the price range into rows and calculates volume delta at each level
Delta Visualization: Displays horizontal bars showing the percentage difference between buying and selling volume
Zone Identification: Automatically identifies the most significant supply and demand zones
Visual Integration: Connects volume delta bars with corresponding support/resistance zones on the price chart
Customization Options:
Lookback Period: Set the number of bars to analyze for volume (default: 200)
Price Rows: Control the granularity of the volume analysis (default: 50 rows)
Delta Sections: Adjust the number of horizontal delta bars displayed (default: 20)
Panel Appearance: Customize width, position, and direction of the delta panel
Zone Settings: Control the number of supply/demand zones and their extension (default: 3 zones)
How It Works-
Trendline Logic:
The script continuously scans for pivot highs and lows based on the specified left and right bars
When a pivot is detected, it creates a horizontal line at that price level
The script then looks for the previous pivot of the same type (high or low)
It connects these pivots with a trendline, extending it based on the user-specified setting
A parallel line is created to form a zone, with the distance based on average price volatility
The script filters out invalid trendlines (upward-sloping resistance and downward-sloping support). Only the 3 most recent trendlines are maintained to prevent chart clutter
Volume Delta Logic:
The script divides the price range over the lookback period into the specified number of rows
For each bar in the lookback period, it categorizes volume as bullish (close > open) or bearish (close < open). This volume is assigned to the appropriate price level based on the HLC3 price.
The price levels are grouped into sections, and the net delta (bullish - bearish volume) is calculated for each Horizontal bars are drawn to represent these delta percentages.
The most significant positive and negative deltas are identified and displayed as support and resistance zones. These zones are extended to the left on the price chart and connected to the delta panel with dotted lines.
Ideal Timeframes:
The indicator is versatile and can be used across multiple timeframes, but it performs optimally on specific timeframes depending on your trading style:
For Day Trading:
Optimal Timeframes: 15-minute to 1-hour charts
Why: These timeframes provide a good balance between noise reduction and sufficient volume data. The volume delta analysis is particularly effective on these timeframes as it captures intraday accumulation/distribution patterns while the trendlines remain reliable enough for intraday trading decisions.
For Swing Trading:
Optimal Timeframes: 1-hour to 4-hour charts
Why: These timeframes offer the best combination of reliable trendline formation and meaningful volume analysis. The trendlines on these timeframes are less prone to whipsaws, while the volume delta analysis captures multi-day trading sessions and institutional activity.
For Position Trading:
Optimal Timeframes: Daily and weekly charts
Why: On these higher timeframes, trendlines become extremely reliable as they represent significant market structure points. The volume delta analysis reveals longer-term accumulation and distribution patterns that can define major support and resistance zones for weeks or months.
Timeframe-Specific Adjustments:
Lower Timeframes (1-15 minutes):
Reduce left/right bars for pivots (5-8 bars)
Decrease lookback period for volume delta (50-100 bars)
Increase tolerance multiplier (1.2-1.5) to account for higher volatility
Higher Timeframes (Daily+):
Increase left/right bars for pivots (15-20 bars)
Extend lookback period for volume delta (300-500 bars)
Consider increasing the number of price rows (70-100) for more detailed volume analysis
Usage Guidelines-
For Trendline Analysis:
Use the trendlines as dynamic support and resistance levels
Price reactions at these levels can indicate potential trend continuation or reversal points
The filled zones around trendlines represent areas of price volatility or uncertainty
Consider the slope of the trendline as an indication of trend strength
For Volume Delta Analysis:
The horizontal delta bars show where buying or selling pressure has been concentrated
Green bars indicate areas where buying volume exceeded selling volume (demand)
Red bars indicate areas where selling volume exceeded buying volume (supply)
The highlighted supply and demand zones on the price chart represent significant price levels
These zones can act as future support or resistance areas as price revisits them
Customization Tips:
Trendline Sensitivity: Decrease left/right bars values to detect more pivots (more sensitive) or increase them for fewer, more significant pivots
Zone Width: Adjust the tolerance multiplier to make trendline zones wider or narrower based on your trading style
Volume Analysis: Increase the lookback period for a longer-term volume profile or decrease it for more recent activity
Visual Clarity: Adjust colors and transparency settings to match your chart theme and preferences
Conclusion:
This indicator provides traders with a comprehensive view of both trend dynamics and volume-based support/resistance levels. With these two analytical approaches, the indicator offers valuable insights for identifying potential entry and exit points, trend strength, and key price levels where significant market activity has occurred. The extensive customization options allow traders to adapt the indicator to various trading styles and timeframes, with optimal performance on 15-minute to daily charts depending on their trading horizon.
Chart Attached: NSE HINDZINC, EoD 12/12/25
DISCLAIMER: This information is provided for educational purposes only and should not be considered financial, investment, or trading advice. Please do boost if you like it. Happy Trading.
Göstergeler ve stratejiler

Orderblock Footprints [AlgoAlpha]🟠 OVERVIEW
This script highlights orderblocks and then drills into what actually trades inside them. Zones are created only after an abnormal directional impulse, measured with a z-score on consecutive candle bodies, so the orderblocks are tied to real expansion rather than simple pivots. Once a zone exists, the script overlays lower-timeframe volume footprints inside the candle when price trades back into that zone. The goal is to show not just where an orderblock sits, but whether price is being accepted or absorbed when it is revisited.
🟠 CONCEPTS
Orderblocks are detected after extreme bullish or bearish impulses. The script tracks consecutive body movement up or down, normalizes that distance with a rolling z-score, and only triggers when the move is statistically large. The last opposite candle before that impulse defines the orderblock range. These zones then extend forward until they are either mitigated by price closing through them or they expire by age.
Inside an active zone, the script switches to a lower timeframe and builds a footprint-style profile for each bar. Each candle is split into price rows, counting time-at-price and volume delta. Positive and negative delta are colored separately. Absorption is flagged when opposing delta prints appear in the wick that rejects the zone. In practice: the impulse defines context ; the footprint shows interaction .
🟠 FEATURES
Separate bullish and bearish zones with automatic extension
Volume split inside each zone candle (up vs down volume)
Lower-timeframe footprint with TPO-style rows and delta gradient
Absorption detection using opposing delta in rejection wicks
Alerts for zone creation and absorption events
🟠 USAGE
Setup : Add the script to your chart. It works on any market and timeframe. The lower timeframe for footprints is fixed at 5 minutes, so higher chart timeframes show clearer structure. Use the Z-Score Window to control how strict impulse detection is and Max Box Age to limit how long old zones stay on the chart.
Read the chart : Bullish orderblocks are created after strong upward impulses and are invalidated when price closes below them. Bearish orderblocks are created after strong downward impulses and are invalidated when price closes above them. When price trades inside a zone, footprint rows appear. Green-tinted rows show positive delta; red-tinted rows show negative delta. Absorption labels appear when opposing delta prints into a rejecting wick.
Settings that matter : Increasing the Z-Score Window makes orderblocks rarer but more significant. Disabling Prevent Overlap allows stacked zones if you want to study clustering. Adjusting Rows per bar changes footprint resolution—lower values are cleaner, higher values show more detail but use more objects.

Elev8+ Impulse Levels | Smart Support & ResistanceElev8+ Impulse Levels
Why does price reject specific levels that look "empty" on the chart?
The answer usually lies in the past. These are Institutional Impulses—footprints left behind by massive market moves that algorithms and smart money defend days or even weeks later.
The Elev8+ Impulse Levels indicator is designed to automatically reveal this hidden Market Structure. It scans for the "Perfect Storm" of Volume + Aggression and projects these critical levels forward for you.
🧠 How It Works (The Logic)
This is not a standard Support & Resistance tool. It does not look for swing highs or lows. Instead, it detects Market Intent.
The indicator highlights specific candles where:
Volume Spikes: Buying or Selling pressure exceeds the average by a significant multiplier.
Volatility Expands: The candle body is unusually large relative to recent price action (ATR).
When these two factors combine, it signals that a major player has entered the market. The closing price of this impulse becomes a "Line in the Sand" for future price action.
🎯 How to Trade This Strategy
We built a "Smart Line" feature into this tool that changes the visual style of the level based on price behavior. This helps you trade two distinct setups:
1. The Defense (Bounce)
Visual: 🟢 Solid Lines
The Setup: A Solid Line represents a Fresh Level that has never been touched.
Why it works: Institutions often defend their entry price. When price returns to a fresh Solid Line, look for a rejection or a bounce.
2. The Flip (Break & Retest)
Visual: ◌ Dotted Lines
The Setup: When a candle closes past a level, the indicator automatically dims it to a Dotted Line.
Why it works: This signals a "Breaker Block." If a Support level (Green) is broken, it often flips to become Resistance. Watch for price to come back and "kiss" the Dotted Line from the other side before continuing the trend.
✨ Key Features
Smart Visualization: Lines automatically switch from Solid to Dotted when broken, keeping your chart analysis clean and logical.
Impulse Coloring: The indicator highlights the specific candle that created the level, so you can see the origin of the move.
Fully Customizable: Adjust the sensitivity of the Volume and Size detection to fit any asset class (Crypto, Forex, Futures, or Stocks).
🚀 The Elev8+ Workflow
Elev8+ Impulse Levels gives you the "Map"—it tells you where the market is likely to react.
To know exactly when to enter, we recommend pairing this tool with our premium Elev8+ Reversal Indicator, which specializes in timing the entry signal precisely when price hits these high-value levels.
Build your narrative. See the structure. Elev8 your trading.
Disclaimer: Trading involves high risk. This tool is for educational purposes to assist with technical analysis and does not guarantee future performance.

Pivot Oscillator█ OVERVIEW
Pivot Oscillator is a versatile oscillator that measures market strength by comparing the current price to local price pivots. Values are scaled by ATR, normalized to a 0–100 range, and displayed along with an SMA line.
Oscillator: generates signals suitable for pullback strategies.
SMA line: serves as a momentum indicator.
█ CONCEPTS
Pivot Oscillator is designed with dual functionality:
- Oscillator & signals: ideal for pullback strategies, detecting local highs/lows and short-term reversals.
- SMA (Momentum): shows stable market-side dominance and filters price impulses.
Calculation logic:
- Oscillator = closing price − pivot line (derived from average high/low pivots).
Scaled by ATR and normalized to 0–100:
50 – bullish dominance,
< 50 – bearish dominance.
SMA is computed from smoothed oscillator values and serves as a momentum indicator.
█ FEATURES
Pivot Calculation:
- Pivot Length (lenSwing) – the number of bars used to identify local pivots (highs/lows). Higher values filter only larger extremes, while lower values make the oscillator react faster to local highs and lows.
- Pivot Level (pivotLevel) – determines the position of the pivot line between the average low and high pivots. A value of 0.5 places the pivotLine exactly halfway between the average high and low pivots; values closer to 0 or 1 shift the line toward the low or high pivots, respectively.
- Pivot Lookback (lookback) – the number of recent pivots used to calculate the average pivot, which smooths the pivotLine and reduces noise caused by individual extremes.
- Oscillator calculation: closing price − pivotLine (average of pivots computed from the above parameters).
The pivotLine is then scaled by ATR and normalized to a 0–100 range.
ATR Scaling:
- ATR period (atrLen)
- Multipliers (multUp / multDown) for upper and lower scaling.
Dynamic Colors:
- Oscillator > 50 → green (bullish)
- Oscillator < 50 → red (bearish)
SMA Line (Momentum):
- Smoothed oscillator (SMA) serves as a momentum indicator.
- Dynamic color indicates direction of SMA.
- Helps identify dominant market side and trend.
Overbought / Oversold Zones:
- Configurable OB/OS levels for both oscillator and SMA.
- Dynamic band colors: change depending on SMA relative to maOverbought / maOversold.
- Provides visual confirmation for potential corrections or strong momentum.
Gradients & Visualization:
- Oscillator and SMA gradients (3 layers) with adjustable transparency.
- Gradient visualization for OB/OS zones and oscillator.
- Full customization of colors, line width, and transparency.
Signals:
- Oscillator leaving oversold zone → long signal
- Oscillator leaving overbought zone → short signal
- OB/OS band colors dynamically reflect SMA levels for additional confirmation.
Alerts:
- OB/OS cross alerts.
█ HOW TO USE
Add the indicator to your TradingView chart → Indicators → search for “Pivot Oscillator”.
Parameter Configuration:
- Pivot Settings: pivot length, pivot level, pivot lookback.
- ATR Settings: ATR period, scaling multipliers.
- Threshold Levels: OB/OS levels for oscillator and SMA.
- Signal Settings: SMA length, extra smoothing.
- Style Settings: bullish/bearish colors, OB/OS lines, midline, text colors.
- Gradient Settings: enable/disable gradients and transparency.
Signal Interpretation:
BUY (Long):
- Oscillator leaves the oversold zone (OS crossover).
- OB/OS band color may additionally confirm the signal when SMA < maOversold.
SELL (Short):
- Oscillator leaves the overbought zone (OB crossunder).
- OB/OS band color may additionally confirm the signal when SMA > maOverbought.
█ APPLICATIONS
Pivot Oscillator and SMA can be scaled for different strategies:
- Pullback strategies: oscillator detects local highs/lows.
- Momentum / Trend: SMA shows market-side dominance and trend direction.
Adjust pivot and ATR parameters:
- Lower settings: faster reaction, suitable for scalping or intraday trading.
- Higher settings: more stable readings, suitable for swing trading or longer timeframes.
█ NOTES
- In strong trends, the oscillator may remain in extreme zones for extended periods – reflects dominance, not necessarily a reversal.
- OB/OS levels should be adapted to the instrument and pivot/ATR settings.
- Works best when combined with other tools: support/resistance, market structure, and volume analysis.

3LL+Baby & 3HH+Baby Pattern3LL+Baby & 3HH+Baby Pattern Indicator
Overview
This indicator identifies powerful reversal patterns based on momentum exhaustion and inside bar formations. It detects two specific candlestick patterns that signal potential trend reversals: the bullish 3LL+Baby and the bearish 3HH+Baby.
Pattern Descriptions
📈 3LL+Baby Pattern (Bullish Reversal)
Conditions:
Three consecutive candles form lower lows (each low is lower than the previous)
The fourth candle is bullish/green (closes higher than it opens)
The fourth candle is completely contained within the third candle's range (both high and low)
Interpretation: After a downward momentum with three lower lows, a bullish inside bar (baby candle) suggests sellers are exhausted and buyers may be taking control. This pattern often precedes upward reversals.
📉 3HH+Baby Pattern (Bearish Reversal)
Conditions:
Three consecutive candles form higher highs (each high is higher than the previous)
The fourth candle is bearish/red (closes lower than it opens)
The fourth candle is completely contained within the third candle's range (both high and low)
Interpretation: After upward momentum with three higher highs, a bearish inside bar indicates buyers are losing strength and sellers may be gaining control. This pattern often signals potential downward reversals.
Features
Visual Signals
Green Triangle (↑): Appears below bars when 3LL+Baby pattern is detected
Red Triangle (↓): Appears above bars when 3HH+Baby pattern is detected
Labels: Clear text labels identifying each pattern type
Background Highlighting: Subtle background colors (green for bullish, red for bearish)
Customization Options
Toggle labels on/off
Toggle arrow signals on/off
Enable/disable bullish patterns independently
Enable/disable bearish patterns independently
How to Use
Add to Chart: Apply the indicator to any timeframe and instrument
Configure Settings: Adjust visibility options based on your preference
Set Alerts: Create alerts for immediate pattern notifications
Trading Strategy:
3LL+Baby : Consider long positions or closing shorts
3HH+Baby: Consider short positions or closing longs
Always confirm with additional analysis and risk management
Best Practices
Use in conjunction with support/resistance levels
Combine with volume analysis for confirmation
Works on all timeframes (higher timeframes generally more reliable)
Apply proper risk management and stop-loss orders
Consider the broader market context and trend

ORB Pro - NY Opening Range Breakout [Elev8+]**ORB Pro - NY Opening Range Breakout ** is a comprehensive, professional-grade toolkit designed for intraday traders who rely on the **Opening Range Breakout (ORB)** strategy.
Unlike standard ORB indicators that simply draw lines, this suite offers a complete dashboard-driven system that monitors **four distinct sessions** simultaneously, providing real-time status updates and precision alerts.
### 🎯 What is the Opening Range Breakout (ORB)?
The Opening Range is the price range established during the first period of the trading session (e.g., the first 15 or 30 minutes). This period represents the initial balance between buyers and sellers. A breakout from this range often signals the likely trend direction for the remainder of the session.
### 🚀 Key Features
**1. Multi-ORB Monitoring**
Stop switching settings constantly. This suite monitors four key ranges at once:
* **Pre-Market 15m** (08:00 – 08:15 ET)
* **Pre-Market 30m** (08:00 – 08:30 ET)
* **NY Cash Open 15m** (09:30 – 09:45 ET)
* **NY Cash Open 30m** (09:30 – 10:00 ET)
**2. Smart Status Dashboard**
A compact panel in the bottom-right corner gives you the live state of every session:
* **⏳ Waiting:** The session has not started yet.
* **⚡ Forming:** The range is currently being built.
* **↔️ Range:** The range has formed, but price is still contained within the range.
* **🚀 BULL / 📉 BEAR:** A confirmed breakout has occurred.
* **⛔ OFF:** The session is disabled in settings.
**3. "Dynamic Resolution" Technology**
This is a unique pro feature.
* **Precision:** The script *always* calculates the High/Low levels using 1-minute data, ensuring your support/resistance lines are pixel-perfect regardless of your chart timeframe.
* **Flexibility:** Breakout signals (Alerts/Labels) are triggered based on your *current* chart timeframe. This allows you to trade a 5m or 15m breakout strategy while keeping 1m-level precision on your levels.
**4. Visual Clarity**
* **Breakout Labels:** Automatically plots "BULL" or "BEAR" labels on the exact candle that confirms a breakout.
* **Profit Targets:** Optional toggle to show 1x and 2x profit targets projected from the breakout level.
* **Time-Bound Signals:** Signals are strictly time-bound to the active window to prevent late, low-quality alerts.
### 🛠️ How to Use
1. **Add to Chart:** Works best on intraday timeframes (1m, 5m, 15m).
2. **Configure:** Enable the sessions you trade (e.g., NY 15m) in the settings.
3. **Wait for Forming:** Watch the box form live. The dashboard will show "⚡ Forming".
4. **Trade the Break:** Wait for a candle **Close** outside the range. The dashboard will flip to "BULL" or "BEAR" and a label will appear.
5. **Manage Risk:** Use the opposite side of the range or the midline as your stop loss.
### ⚙️ Settings Overview
* **Global Settings:** Toggle forming boxes, dashboard, and label visibility.
* **Breakout Method:** Choose between **Close** (safer) or **Wick** (aggressive) for signal triggers.
* **Session Groups:** Individually enable/disable the 4 distinct sessions and customize their colors/styles.
---
*Disclaimer: This tool is for educational and analytical purposes only. Past performance of a strategy does not guarantee future results. Always manage your risk.*

NQ 300+ Point Day Checklist (Bias + Alerts + Markers)This indicator helps identify high-range (≥300-point) days on Nasdaq-100 futures (NQ / MNQ) using a clear, rule-based checklist.
It evaluates volatility, compression, price displacement, prior-day structure, and overnight activity to generate a daily expansion score (0–6). Higher scores signal an increased likelihood of a strong trending or expansion day.
The script also provides:
Expansion probability levels (Normal / Watch / High-Prob)
Bullish, bearish, or neutral bias
On-chart markers and background highlights
Optional alerts for early awareness
Best used on the Daily timeframe to help traders focus on high-opportunity days and avoid overtrading during consolidation.
This is a context and probability tool — not a trade signal.

able FRVP Reversal# able FRVP Reversal - Complete User Guide
## 📌 Overview
**able FRVP Reversal** is a professional-grade Volume Profile indicator with an integrated reversal detection system. It combines Fixed Range Volume Profile (FRVP) analysis with a confluence-based reversal scoring system to identify high-probability turning points at key volume levels.
---
## ✨ Key Features
| Feature | Description |
|---------|-------------|
| **Session-Based Volume Profile** | Automatically resets at the beginning of each regular trading session |
| **POC (Point of Control)** | Highest volume price level - strongest support/resistance |
| **VAH (Value Area High)** | Upper boundary of the 70% value area - resistance zone |
| **VAL (Value Area Low)** | Lower boundary of the 70% value area - support zone |
| **Confluence Scoring System** | 5-point scoring system for reversal detection |
| **Smart Cooldown** | Prevents signal spam with customizable cooldown period |
| **Real-time Info Table** | Displays all key metrics in a retro-style dashboard |
---
## 🔧 Installation
1. Open TradingView and go to **Pine Editor**
2. Delete any existing code and paste the indicator code
3. Click **"Add to Chart"**
4. Configure settings as needed
---
## ⚙️ Settings Explained
### 📊 Volume Profile Settings
| Setting | Default | Description |
|---------|---------|-------------|
| **Number of Rows** | 50 | Resolution of the volume profile (more rows = finer detail) |
| **Value Area %** | 70 | Percentage of volume to include in Value Area (industry standard: 70%) |
| **Profile Width** | 40 | Visual width of the histogram on chart |
| **Show Histogram** | ✓ | Display volume histogram bars |
| **Show POC/VAH/VAL** | ✓ | Display the three key levels |
| **Show Labels** | ✓ | Display price labels for each level |
| **Extend Lines** | ✓ | Extend levels to the right of current price |
| **Extend Length** | 100 | How far to extend the lines (in bars) |
### 🔄 Reversal Detection Settings
| Setting | Default | Description |
|---------|---------|-------------|
| **Enable Reversal Detection** | ✓ | Turn reversal signals on/off |
| **Min Confluence Score** | 3 | Minimum score required to trigger signal (1-5) |
| **Cooldown Bars** | 10 | Minimum bars between signals to prevent spam |
#### Understanding Min Confluence Score:
- **Score 1-2**: Very sensitive, many signals (not recommended)
- **Score 3**: Balanced - good for most traders ⭐ Recommended
- **Score 4**: Conservative - fewer but higher quality signals
- **Score 5**: Very strict - only strongest reversals
### 🎨 Color Settings
All colors are fully customizable:
- **POC Line**: Default Gold (#FFD700)
- **VAH Line**: Default Coral Red (#FF6B6B)
- **VAL Line**: Default Teal (#4ECDC4)
- **Bullish Reversal**: Default Green (#00E676)
- **Bearish Reversal**: Default Red (#FF5252)
---
## 📖 How to Read the Indicator
### Volume Profile Histogram
```
█████████████ ← High volume = Strong S/R
████████ ← Medium volume
████ ← Low volume = Weak S/R
██
```
- **Darker/Longer bars** = More trading activity at that price
- **Inside Value Area** = Colored based on session direction (Bull/Bear)
- **Outside Value Area** = Muted gray color
### Key Levels
| Level | Color | Meaning |
|-------|-------|---------|
| **POC** | Yellow | Price with highest volume - Strongest magnet |
| **VAH** | Red | Upper resistance - Look for bearish reversals |
| **VAL** | Teal | Lower support - Look for bullish reversals |
---
## 🔄 Reversal Detection System
### How the Scoring System Works
The indicator uses a **5-point confluence scoring system**. Each condition adds 1 point:
#### 🟢 Bullish Reversal Score (at VAL)
| Condition | Points | Description |
|-----------|--------|-------------|
| Price at VAL Zone | +1 | Price is within VAL ± 0.2 ATR |
| Bullish Candle | +1 | Close > Open (green candle) |
| RSI Oversold | +1 | RSI < 35 |
| Rejection Wick | +1 | Lower wick > 1.5× body size |
| Failed Breakdown | +1 | Touched below VAL but closed above |
#### 🔴 Bearish Reversal Score (at VAH)
| Condition | Points | Description |
|-----------|--------|-------------|
| Price at VAH Zone | +1 | Price is within VAH ± 0.2 ATR |
| Bearish Candle | +1 | Close < Open (red candle) |
| RSI Overbought | +1 | RSI > 65 |
| Rejection Wick | +1 | Upper wick > 1.5× body size |
| Failed Breakout | +1 | Touched above VAH but closed below |
### Signal Quality Ratings
| Score | Rating | Meaning |
|-------|--------|---------|
| 5/5 | ★★★ | Excellent - Highest probability |
| 4/5 | ★★ | Good - High probability |
| 3/5 | ★ | Acceptable - Moderate probability |
| <3 | - | No signal triggered |
---
## 📋 Info Table Explained
```
╔═ able-REV ═╗ 15 ████████ SCR
─────────────────────────────────────
ZONE UPPER VA ▒▒▓▓████ ▲
POC 4272.680 ██████·· ▲
VAH 4322.745 ████···· ·
VAL 4264.977 ██████·· ·
═ SCORE ═════════════════════════════
BULL 0/5 ········ ·
BEAR 1/5 ░······· ·
RSI 49 ▒▒▓▓···· ·
◄SIGNAL► WAIT ········ ·
```
| Row | Description |
|-----|-------------|
| **ZONE** | Current price position relative to Value Area |
| **POC/VAH/VAL** | Price levels with distance indicators |
| **BULL Score** | Current bullish confluence score |
| **BEAR Score** | Current bearish confluence score |
| **RSI** | RSI value with OB/OS status |
| **SIGNAL** | Current signal status (BUY/SELL/WAIT) |
### Zone Types
| Zone | Meaning | Bias |
|------|---------|------|
| ABOVE VAH | Price broke above resistance | Bullish (but watch for rejection) |
| ⚠ AT VAH | Price testing resistance | Watch for bearish reversal |
| UPPER VA | Price in upper value area | Slight bullish bias |
| LOWER VA | Price in lower value area | Slight bearish bias |
| ⚠ AT VAL | Price testing support | Watch for bullish reversal |
| BELOW VAL | Price broke below support | Bearish (but watch for rejection) |
---
## 📈 Trading Strategies
### Strategy 1: VAH Rejection (Bearish Reversal)
**Setup:**
1. Price approaches or touches VAH (red dashed line)
2. BEAR score reaches 3+ (or your minimum setting)
3. REV signal appears above the candle
**Entry:**
- Enter SHORT on signal candle close
- Or wait for confirmation candle
**Stop Loss:**
- Above the signal candle high
- Or above VAH + 0.5 ATR
**Take Profit:**
- First target: POC (yellow line)
- Second target: VAL (teal line)
---
### Strategy 2: VAL Bounce (Bullish Reversal)
**Setup:**
1. Price approaches or touches VAL (teal dashed line)
2. BULL score reaches 3+ (or your minimum setting)
3. REV signal appears below the candle
**Entry:**
- Enter LONG on signal candle close
- Or wait for confirmation candle
**Stop Loss:**
- Below the signal candle low
- Or below VAL - 0.5 ATR
**Take Profit:**
- First target: POC (yellow line)
- Second target: VAH (red line)
---
### Strategy 3: POC Bounce
**Setup:**
1. Price pulls back to POC after trending
2. POC acts as support/resistance
3. Watch for reversal candle patterns
**Entry:**
- Long if bullish candle at POC from below
- Short if bearish candle at POC from above
**Stop Loss:**
- Other side of POC ± buffer
---
## ⚠️ Important Notes
### When Signals Work Best
✅ **High Probability Setups:**
- Score 4-5 with clear rejection wick
- RSI confirms (oversold for long, overbought for short)
- First test of VAH/VAL in the session
- Clear trend before reversal
❌ **Low Probability Setups:**
- Score barely meeting minimum (3/5)
- Multiple tests of same level (level weakening)
- Low volume/choppy market
- News events pending
### Risk Management Rules
1. **Never risk more than 1-2% per trade**
2. **Always use stop loss** - place beyond the level
3. **Wait for candle close** - don't enter on wick touches
4. **Respect the cooldown** - avoid overtrading
5. **Consider the trend** - counter-trend reversals are riskier
---
## 🔔 Alerts
The indicator includes built-in alerts:
| Alert | Trigger |
|-------|---------|
| VAL Bullish Reversal | BULL score meets minimum at VAL |
| VAH Bearish Reversal | BEAR score meets minimum at VAH |
### Setting Up Alerts:
1. Right-click on the chart
2. Select "Add Alert"
3. Choose "able FRVP Reversal" as condition
4. Select desired alert type
5. Configure notification method
---
## 💡 Pro Tips
1. **Combine with trend analysis** - Reversals in trend direction are more reliable
2. **Watch for confluence with other S/R** - If VAH/VAL aligns with round numbers, previous highs/lows, or fib levels, the level is stronger
3. **Volume confirmation** - Higher volume on reversal candle = stronger signal
4. **Time of day matters** - Reversals during active trading hours are more reliable
5. **Adjust sensitivity by market** - Volatile assets may need higher Min Confluence Score
6. **Use multiple timeframes** - Check if reversal level aligns with higher timeframe levels
---
## 🔧 Recommended Settings by Trading Style
| Style | Min Confluence | Cooldown | Best For |
|-------|----------------|----------|----------|
| Scalping | 3 | 5-7 | Quick trades, more signals |
| Day Trading | 3-4 | 10-15 | Balanced approach |
| Swing Trading | 4-5 | 20+ | Fewer, higher quality signals |
---
## ❓ Troubleshooting
| Issue | Solution |
|-------|----------|
| No signals appearing | Lower Min Confluence Score or check if market is ranging |
| Too many signals | Increase Min Confluence Score or Cooldown Bars |
| Levels not showing | Enable Show POC/VAH/VAL in settings |
| Histogram too wide/narrow | Adjust Profile Width setting |
---
## 📞 Support
For questions, suggestions, or bug reports, please contact the developer.
---
**Version:** 1.0
**Last Updated:** 2024
**Platform:** TradingView (Pine Script v6)

True vs False Breakout (Vol + Body Shape) **Indicator Description: True vs. False Breakout Detector**
This indicator helps identify the quality of a breakout by analyzing price action and volume.
**★ Green Arrow: "True Breakout (Strong Candle)"**
This represents a high-confidence breakout signal.
* **Criteria:** Price Breakout + Volume Surge + Strong Candle Close (minimal to no upper wick).
* **Significance:** Indicates strong bullish momentum.
**● Grey Dot: "Weak Breakout"**
Appears when price breaks resistance but shows signs of weakness.
* **Criteria:** Breakout with low volume OR a long upper wick (rejection).
* **Meaning:** "Price made a new high, but the move is untrustworthy."
* **Action:** Do not chase the long position. Be cautious and look for potential reversals.
**▼ Red Label: "False Breakout (Reversal)"**
* **Signal:** Appears when a Weak Breakout (Grey Dot) is followed by bearish price action.
* **Action:** This indicates a confirmed False Breakout and presents a prime shorting opportunity.
-------------------------------------------------------------------------------------------
★指标描述:真假突破辨别。
★绿色箭头 "真突破 (强K线)":
这是你要的完美信号。
它意味着:价格破位 + 成交量放大 + K线收盘坚决(几乎没有上影线)。
对应刚才的行情: 刚才那根1H大阳线应该会触发这个信号。
灰色圆点 "弱势突破" (新增):
如果价格突破了阻力,但是没量,或者留了长上影线(像你之前描述的那几根15分钟线),指标会标记灰色圆点。
含义: “虽然价格破了新高,但我不信任它”。这时候千万不要追多,反而要准备做空。
红色标签 "假突破 (反转)":
当灰色圆点(弱势突破)出现后,紧接着出现红色标签,就是绝佳的做空点。

MACD-V Multi-Timeframe Confluence DashboardThis indicator identifies high-probability trade entries by analyzing momentum alignment across multiple timeframes using the MACD-V (Volatility Normalized MACD) formula. It features a fully customizable signal engine that allows traders to specify exactly which timeframes must agree before a trade signal is generated.
Optimized Defaults
By default, the indicator is tuned to the 5-minute, 15-minute, and 1-hour timeframes. We have found this specific combination performs best for identifying robust trends while filtering out noise. However, the strategy is fully flexible—users can easily adjust these settings to fit scalping (1m/5m) or swing trading (4H/Daily) styles.
Indicator Features
Dynamic Confluence: A Buy or Sell signal (displayed as a large + on the chart) is generated only when all selected timeframes are in agreement. This ensures you are trading with the dominant trend across multiple time scales.
Alternating Signal Filter: To prevent repetitive alerts during strong trends, the script uses a smart filter: a new Buy signal will only trigger if the last confirmed signal was a Sell (and vice versa).
Live Dashboard: An on-screen table displays the real-time status of every timeframe (Trend, Curl, and MACD Value). Timeframes currently active in your strategy are highlighted in yellow.
Local Entry Arrows (Optional): The script includes smaller red/green arrows that indicate simple MACD line crosses on the current chart's timeframe. These can be useful for precise timing but can be noisy in choppy markets. These are turned off by default to keep the chart clean, but can be enabled in the "Visuals" settings if you require granular entry signals.
How to Use
Check the Dashboard: Look for the yellow-highlighted rows in the table to see which timeframes are currently driving your signals.
Wait for the Cross (+): A green + indicates bullish momentum is aligned across all your chosen timeframes.
Refine (Optional): Turn on "Show Local Arrows" if you want to see the specific moment the MACD crosses on your current timeframe to fine-tune your entry.


Take Profit XTake Profit X
Take Profit X solves the #1 problem in trading: knowing when to exit. Instead of guessing or using single indicators, it aggregates 8 technical signals to identify high-probability exit points through multi-confirmation consensus. This eliminates premature exits and emotional decision-making.
The indicator counts confirmations from your chosen technical tools:
Green dot = Multiple signals say "take profit on longs/exit shorts"
Red dot = Multiple signals say "take profit on shorts/exit longs"
Signals appear when you reach the minimum confirmations threshold you set.
Possible Settings:
Conservative (Swing Trading)
pine
Minimum Confirmations: 4
Use: RSI, MACD, CCI, Supertrend, Price Action
Disable: Stochastic, Bollinger Bands, EMA Cross
Look Back Bars: 10
Aggressive (Day Trading)
pine
Minimum Confirmations: 2
Use: All indicators ON
Look Back Bars: 3-5
RSI OB/OS: 75/25
Balanced (Most Markets)
pine
Minimum Confirmations: 3
Use: RSI, MACD, CCI, Supertrend
Price Action: ON
Look Back Bars: 5-7

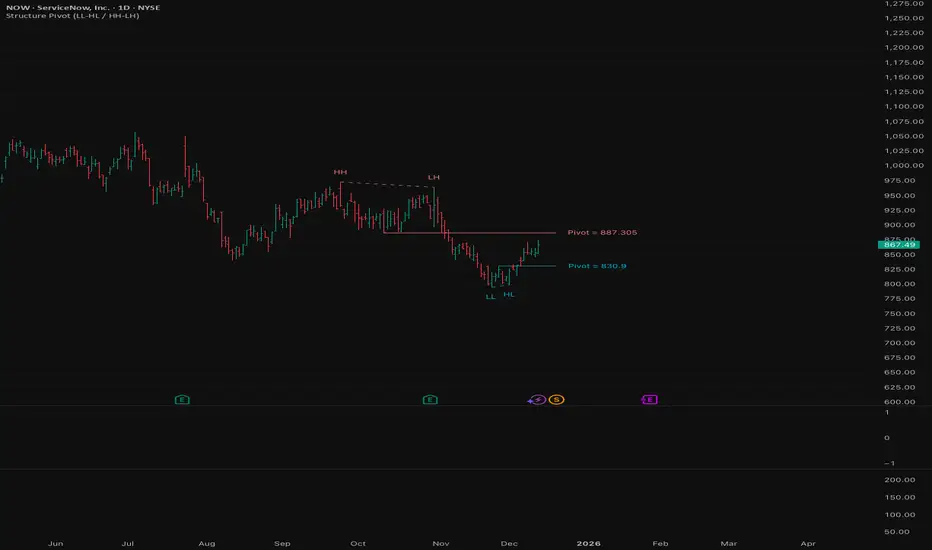
Structure Pivot (LL-HL / HH-LH)Structure Pivot (LL-HL / HH-LH) - Indicator Guide
This indicator scans for market structure pivot patterns—specifically the bullish Higher Low (LL–HL) and the bearish Lower High (HH–LH) —across multiple lengths simultaneously.
It automatically selects the most optimal pattern based on a "Priority Mode" and plots the structure and breakout/breakdown levels on the chart.
1. Basic Calculation Method
The indicator builds upon TradingView’s ta.pivotlow and ta.pivothigh functions to identify structural points.
Bullish Structure (LL–HL)
1.LL (Lowest Low): A standard Pivot Low is identified.
2.HL (Higher Low): A subsequent Pivot Low forms higher than the previous LL. This completes the setup.
3.Pivot Line (Resistance): The indicator finds the highest price (High) that occurred between the LL and the HL. This level becomes the breakout trigger.
Bearish Structure (HH–LH)
1.HH (Highest High): A standard Pivot High is identified.
2.LH (Lower High): A subsequent Pivot High forms lower than the previous HH. This completes the setup.
3.Pivot Line (Support): The indicator finds the lowest price (Low) that occurred between the HH and the LH. This level becomes the breakdown trigger.
2. Multi-Length Scanning
Unlike standard indicators that use a single fixed length (e.g., Length = 5), this indicator scans a range of lengths simultaneously.
・Settings: Defined by Min Length and Max Length.
・Mechanism: If set to Min=2 and Max=10, the indicator internally runs 9 separate calculations (Length 2 through 10) in parallel.
This allows it to capture everything from small, short-term pullbacks to larger, significant structural pivots without manual adjustment.
3. Priority Mode System
Since multiple lengths are scanned, multiple valid patterns may appear at the same time. The Priority Mode determines which single pattern is the "winner" and gets displayed.
A. Tightest Structure (Default)
・For Bullish (Long): Selects the pattern with the lowest Pivot Line (Resistance).
・For Bearish (Short): Selects the pattern with the highest Pivot Line (Support).
・Advantage: It finds the "tightest" contraction (like a VCP). This offers the entry point closest to the stop-loss level, providing the best Risk/Reward ratio.
B. Longest Length
・Selects the pattern detected by the longest length setting.
・Advantage: Focuses on major structural points, filtering out short-term noise. Best for trend confirmation.
C. Shortest Length
・Selects the pattern detected by the shortest length setting.
・Advantage: Extremely sensitive. Best for scalping or catching immediate micro-pullbacks.
4. Real-Time Logic & Features
Structure Invalidation (Failure)
・Bullish: If the current price drops below the HL (the support of the structure), the setup is considered failed.
・Bearish: If the current price rises above the LH (the resistance of the structure), the setup is considered failed.
・Result: All lines and labels for that structure are immediately deleted to keep the chart clean.
Pivot Line Extension
・As long as the structure remains valid (price hasn't violated the HL or LH), the Pivot Line extends to the right, acting as a live reference for breakouts or breakdowns.
Alerts
・Bullish Breakout: Triggered when the Close price crosses over the Pivot Line.
・Bearish Breakdown: Triggered when the Close price crosses under the Pivot Line.
Razzere Cloned! EzAlgo V.8.1showBuySell = input(true, "Show Buy & Sell", group="BUY & SELL SIGNALS")
hassasiyet = input.float(3, "Hassasiyet (1-6)", 0.1, 99999, group="BUY & SELL SIGNALS")
percentStop = input.float(1, "Stop Loss % (0 to Disable)", 0, group="BUY & SELL SIGNALS")
offsetSignal = input.float(5, "Signals Offset", 0, group="BUY & SELL SIGNALS")
showRibbon = input(true, "Show Trend Ribbon", group="TREND RIBBON")
smooth1 = input.int(5, "Smoothing 1", 1, group="TREND RIBBON")
smooth2 = input.int(8, "Smoothing 2", 1, group="TREND RIBBON")
showreversal = input(true, "Show Reversals", group="REVERSAL SIGNALS")
showPdHlc = input(false, "Show P.D H/L/C", group="PREVIOUS DAY HIGH LOW CLOSE")
lineColor = input.color(color.yellow, "Line Colors", group="PREVIOUS DAY HIGH LOW CLOSE")
lineWidth = input.int(1, "Width Lines", group="PREVIOUS DAY HIGH LOW CLOSE")
lineStyle = input.string("Solid", "Line Style", )
labelSize = input.string("normal", "Label Text Size", )
labelColor = input.color(color.yellow, "Label Text Colors")
showEmas = input(false, "Show EMAs", group="EMA")
srcEma1 = input(close, "Source EMA 1")
lenEma1 = input.int(7, "Length EMA 1", 1)
srcEma2 = input(close, "Source EMA 2")
lenEma2 = input.int(21, "Length EMA 2", 1)
srcEma3 = input(close, "Source EMA 3")
lenEma3 = input.int(144, "Length EMA 3", 1)
showSwing = input(false, "Show Swing Points", group="SWING POINTS")
prdSwing = input.int(10, "Swing Point Period", 2, group="SWING POINTS")
colorPos = input(color.new(color.green, 50), "Positive Swing Color")
colorNeg = input(color.new(color.red, 50), "Negative Swing Color")
showDashboard = input(true, "Show Dashboard", group="TREND DASHBOARD")
locationDashboard = input.string("Middle Right", "Table Location", , group="TREND DASHBOARD")
tableTextColor = input(color.white, "Table Text Color", group="TREND DASHBOARD")
tableBgColor = input(#2A2A2A, "Table Background Color", group="TREND DASHBOARD")
sizeDashboard = input.string("Normal", "Table Size", , group="TREND DASHBOARD")
showRevBands = input.bool(true, "Show Reversal Bands", group="REVERSAL BANDS")
lenRevBands = input.int(30, "Length", group="REVERSAL BANDS")
// Fonksiyonlar
smoothrng(x, t, m) =>
wper = t * 2 - 1
avrng = ta.ema(math.abs(x - x ), t)
smoothrng = ta.ema(avrng, wper) * m
rngfilt(x, r) =>
rngfilt = x
rngfilt := x > nz(rngfilt ) ? x - r < nz(rngfilt ) ? nz(rngfilt ) : x - r : x + r > nz(rngfilt ) ? nz(rngfilt ) : x + r
percWidth(len, perc) => (ta.highest(len) - ta.lowest(len)) * perc / 100
securityNoRep(sym, res, src) => request.security(sym, res, src, barmerge.gaps_off, barmerge.lookahead_on)
swingPoints(prd) =>
pivHi = ta.pivothigh(prd, prd)
pivLo = ta.pivotlow (prd, prd)
last_pivHi = ta.valuewhen(pivHi, pivHi, 1)
last_pivLo = ta.valuewhen(pivLo, pivLo, 1)
hh = pivHi and pivHi > last_pivHi ? pivHi : na
lh = pivHi and pivHi < last_pivHi ? pivHi : na
hl = pivLo and pivLo > last_pivLo ? pivLo : na
ll = pivLo and pivLo < last_pivLo ? pivLo : na
f_chartTfInMinutes() =>
float _resInMinutes = timeframe.multiplier * (
timeframe.isseconds ? 1 :
timeframe.isminutes ? 1. :
timeframe.isdaily ? 60. * 24 :
timeframe.isweekly ? 60. * 24 * 7 :
timeframe.ismonthly ? 60. * 24 * 30.4375 : na)
f_kc(src, len, hassasiyet) =>
basis = ta.sma(src, len)
span = ta.atr(len)
wavetrend(src, chlLen, avgLen) =>
esa = ta.ema(src, chlLen)
d = ta.ema(math.abs(src - esa), chlLen)
ci = (src - esa) / (0.015 * d)
wt1 = ta.ema(ci, avgLen)
wt2 = ta.sma(wt1, 3)
f_top_fractal(src) => src < src and src < src and src > src and src > src
f_bot_fractal(src) => src > src and src > src and src < src and src < src
f_fractalize (src) => f_top_fractal(src) ? 1 : f_bot_fractal(src) ? -1 : 0
f_findDivs(src, topLimit, botLimit) =>
fractalTop = f_fractalize(src) > 0 and src >= topLimit ? src : na
fractalBot = f_fractalize(src) < 0 and src <= botLimit ? src : na
highPrev = ta.valuewhen(fractalTop, src , 0)
highPrice = ta.valuewhen(fractalTop, high , 0)
lowPrev = ta.valuewhen(fractalBot, src , 0)
lowPrice = ta.valuewhen(fractalBot, low , 0)
bearSignal = fractalTop and high > highPrice and src < highPrev
bullSignal = fractalBot and low < lowPrice and src > lowPrev
// Bileşen...
source = close
smrng1 = smoothrng(source, 27, 1.5)
smrng2 = smoothrng(source, 55, hassasiyet)
smrng = (smrng1 + smrng2) / 2
filt = rngfilt(source, smrng)
up = 0.0, up := filt > filt ? nz(up ) + 1 : filt < filt ? 0 : nz(up )
dn = 0.0, dn := filt < filt ? nz(dn ) + 1 : filt > filt ? 0 : nz(dn )
bullCond = bool(na), bullCond := source > filt and source > source and up > 0 or source > filt and source < source and up > 0
bearCond = bool(na), bearCond := source < filt and source < source and dn > 0 or source < filt and source > source and dn > 0
lastCond = 0, lastCond := bullCond ? 1 : bearCond ? -1 : lastCond
bull = bullCond and lastCond == -1
bear = bearCond and lastCond == 1
countBull = ta.barssince(bull)
countBear = ta.barssince(bear)
trigger = nz(countBull, bar_index) < nz(countBear, bar_index) ? 1 : 0
ribbon1 = ta.sma(close, smooth1)
ribbon2 = ta.sma(close, smooth2)
rsi = ta.rsi(close, 21)
rsiOb = rsi > 70 and rsi > ta.ema(rsi, 10)
rsiOs = rsi < 30 and rsi < ta.ema(rsi, 10)
dHigh = securityNoRep(syminfo.tickerid, "D", high )
dLow = securityNoRep(syminfo.tickerid, "D", low )
dClose = securityNoRep(syminfo.tickerid, "D", close )
ema1 = ta.ema(srcEma1, lenEma1)
ema2 = ta.ema(srcEma2, lenEma2)
ema3 = ta.ema(srcEma3, lenEma3)
= swingPoints(prdSwing)
ema = ta.ema(close, 144)
emaBull = close > ema
equal_tf(res) => str.tonumber(res) == f_chartTfInMinutes() and not timeframe.isseconds
higher_tf(res) => str.tonumber(res) > f_chartTfInMinutes() or timeframe.isseconds
too_small_tf(res) => (timeframe.isweekly and res=="1") or (timeframe.ismonthly and str.tonumber(res) < 10)
securityNoRep1(sym, res, src) =>
bool bull_ = na
bull_ := equal_tf(res) ? src : bull_
bull_ := higher_tf(res) ? request.security(sym, res, src, barmerge.gaps_off, barmerge.lookahead_on) : bull_
bull_array = request.security_lower_tf(syminfo.tickerid, higher_tf(res) ? str.tostring(f_chartTfInMinutes()) + (timeframe.isseconds ? "S" : "") : too_small_tf(res) ? (timeframe.isweekly ? "3" : "10") : res, src)
if array.size(bull_array) > 1 and not equal_tf(res) and not higher_tf(res)
bull_ := array.pop(bull_array)
array.clear(bull_array)
bull_
TF1Bull = securityNoRep1(syminfo.tickerid, "1" , emaBull)
TF3Bull = securityNoRep1(syminfo.tickerid, "3" , emaBull)
TF5Bull = securityNoRep1(syminfo.tickerid, "5" , emaBull)
TF15Bull = securityNoRep1(syminfo.tickerid, "15" , emaBull)
TF30Bull = securityNoRep1(syminfo.tickerid, "30" , emaBull)
TF60Bull = securityNoRep1(syminfo.tickerid, "60" , emaBull)
TF120Bull = securityNoRep1(syminfo.tickerid, "120" , emaBull)
TF240Bull = securityNoRep1(syminfo.tickerid, "240" , emaBull)
TF480Bull = securityNoRep1(syminfo.tickerid, "480" , emaBull)
TFDBull = securityNoRep1(syminfo.tickerid, "1440", emaBull)
= f_kc(close, lenRevBands, 3)
= f_kc(close, lenRevBands, 4)
= f_kc(close, lenRevBands, 5)
= f_kc(close, lenRevBands, 6)
= wavetrend(hlc3, 9, 12)
= f_findDivs(wt2, 15, -40)
= f_findDivs(wt2, 45, -65)
wtDivBull = wtDivBull1 or wtDivBull2
wtDivBear = wtDivBear1 or wtDivBear2
// Renkler
cyan = #00DBFF, cyan30 = color.new(cyan, 70)
pink = #E91E63, pink30 = color.new(pink, 70)
red = #FF5252, red30 = color.new(red , 70)
// Plotlar
off = percWidth(300, offsetSignal)
plotshape(showBuySell and bull ? low - off : na, "Buy Label" , shape.labelup , location.absolute, cyan, 0, "Buy" , color.white, size=size.normal)
plotshape(showBuySell and bear ? high + off : na, "Sell Label", shape.labeldown, location.absolute, pink, 0, "Sell", color.white, size=size.normal)
plotshape(ta.crossover(wt1, wt2) and wt2 <= -53, "Mild Buy" , shape.xcross, location.belowbar, cyan, size=size.tiny)
plotshape(ta.crossunder(wt1, wt2) and wt2 >= 53, "Mild Sell", shape.xcross, location.abovebar, pink, size=size.tiny)
plotshape(wtDivBull, "Divergence Buy ", shape.triangleup , location.belowbar, cyan, size=size.tiny)
plotshape(wtDivBear, "Divergence Sell", shape.triangledown, location.abovebar, pink, size=size.tiny)
barcolor(up > dn ? cyan : pink)
plotshape(showreversal and rsiOs, "Reversal Buy" , shape.diamond, location.belowbar, cyan30, size=size.tiny)
plotshape(showreversal and rsiOb, "Reversal Sell", shape.diamond, location.abovebar, pink30, size=size.tiny)
lStyle = lineStyle == "Solid" ? line.style_solid : lineStyle == "Dotted" ? line.style_dotted : line.style_dashed
lSize = labelSize == "small" ? size.small : labelSize == "normal" ? size.normal : size.large
dHighLine = showPdHlc ? line.new(bar_index, dHigh, bar_index + 1, dHigh , xloc.bar_index, extend.both, lineColor, lStyle, lineWidth) : na, line.delete(dHighLine )
dLowLine = showPdHlc ? line.new(bar_index, dLow , bar_index + 1, dLow , xloc.bar_index, extend.both, lineColor, lStyle, lineWidth) : na, line.delete(dLowLine )
dCloseLine = showPdHlc ? line.new(bar_index, dClose, bar_index + 1, dClose, xloc.bar_index, extend.both, lineColor, lStyle, lineWidth) : na, line.delete(dCloseLine )
dHighLabel = showPdHlc ? label.new(bar_index + 100, dHigh , "P.D.H", xloc.bar_index, yloc.price, #000000, label.style_none, labelColor, lSize) : na, label.delete(dHighLabel )
dLowLabel = showPdHlc ? label.new(bar_index + 100, dLow , "P.D.L", xloc.bar_index, yloc.price, #000000, label.style_none, labelColor, lSize) : na, label.delete(dLowLabel )
dCloseLabel = showPdHlc ? label.new(bar_index + 100, dClose, "P.D.C", xloc.bar_index, yloc.price, #000000, label.style_none, labelColor, lSize) : na, label.delete(dCloseLabel )
plot(showEmas ? ema1 : na, "EMA 1", color.green , 2)
plot(showEmas ? ema2 : na, "EMA 2", color.purple, 2)
plot(showEmas ? ema3 : na, "EMA 3", color.yellow, 2)
plotshape(showSwing ? hh : na, "", shape.triangledown, location.abovebar, color.new(color.green, 50), -prdSwing, "HH", colorPos, false)
plotshape(showSwing ? hl : na, "", shape.triangleup , location.belowbar, color.new(color.green, 50), -prdSwing, "HL", colorPos, false)
plotshape(showSwing ? lh : na, "", shape.triangledown, location.abovebar, color.new(color.red , 50), -prdSwing, "LH", colorNeg, false)
plotshape(showSwing ? ll : na, "", shape.triangleup , location.belowbar, color.new(color.red , 50), -prdSwing, "LL", colorNeg, false)
srcStop = close
atrBand = srcStop * (percentStop / 100)
atrStop = trigger ? srcStop - atrBand : srcStop + atrBand
lastTrade(src) => ta.valuewhen(bull or bear, src, 0)
entry_y = lastTrade(srcStop)
stop_y = lastTrade(atrStop)
tp1_y = (entry_y - lastTrade(atrStop)) * 1 + entry_y
tp2_y = (entry_y - lastTrade(atrStop)) * 2 + entry_y
tp3_y = (entry_y - lastTrade(atrStop)) * 3 + entry_y
labelTpSl(y, txt, color) =>
label labelTpSl = percentStop != 0 ? label.new(bar_index + 1, y, txt, xloc.bar_index, yloc.price, color, label.style_label_left, color.white, size.normal) : na
label.delete(labelTpSl )
labelTpSl(entry_y, "Entry: " + str.tostring(math.round_to_mintick(entry_y)), color.gray)
labelTpSl(stop_y , "Stop Loss: " + str.tostring(math.round_to_mintick(stop_y)), color.red)
labelTpSl(tp1_y, "Take Profit 1: " + str.tostring(math.round_to_mintick(tp1_y)), color.green)
labelTpSl(tp2_y, "Take Profit 2: " + str.tostring(math.round_to_mintick(tp2_y)), color.green)
labelTpSl(tp3_y, "Take Profit 3: " + str.tostring(math.round_to_mintick(tp3_y)), color.green)
lineTpSl(y, color) =>
line lineTpSl = percentStop != 0 ? line.new(bar_index - (trigger ? countBull : countBear) + 4, y, bar_index + 1, y, xloc.bar_index, extend.none, color, line.style_solid) : na
line.delete(lineTpSl )
lineTpSl(entry_y, color.gray)
lineTpSl(stop_y, color.red)
lineTpSl(tp1_y, color.green)
lineTpSl(tp2_y, color.green)
lineTpSl(tp3_y, color.green)
var dashboard_loc = locationDashboard == "Top Right" ? position.top_right : locationDashboard == "Middle Right" ? position.middle_right : locationDashboard == "Bottom Right" ? position.bottom_right : locationDashboard == "Top Center" ? position.top_center : locationDashboard == "Middle Center" ? position.middle_center : locationDashboard == "Bottom Center" ? position.bottom_center : locationDashboard == "Top Left" ? position.top_left : locationDashboard == "Middle Left" ? position.middle_left : position.bottom_left
var dashboard_size = sizeDashboard == "Large" ? size.large : sizeDashboard == "Normal" ? size.normal : sizeDashboard == "Small" ? size.small : size.tiny
var dashboard = showDashboard ? table.new(dashboard_loc, 2, 15, tableBgColor, #000000, 2, tableBgColor, 1) : na
dashboard_cell(column, row, txt, signal=false) => table.cell(dashboard, column, row, txt, 0, 0, signal ? #000000 : tableTextColor, text_size=dashboard_size)
dashboard_cell_bg(column, row, col) => table.cell_set_bgcolor(dashboard, column, row, col)
if barstate.islast and showDashboard
dashboard_cell(0, 0 , "EzAlgo")
dashboard_cell(0, 1 , "Current Position")
dashboard_cell(0, 2 , "Current Trend")
dashboard_cell(0, 3 , "Volume")
dashboard_cell(0, 4 , "Timeframe")
dashboard_cell(0, 5 , "1 min:")
dashboard_cell(0, 6 , "3 min:")
dashboard_cell(0, 7 , "5 min:")
dashboard_cell(0, 8 , "15 min:")
dashboard_cell(0, 9 , "30 min:")
dashboard_cell(0, 10, "1 H:")
dashboard_cell(0, 11, "2 H:")
dashboard_cell(0, 12, "4 H:")
dashboard_cell(0, 13, "8 H:")
dashboard_cell(0, 14, "Daily:")
dashboard_cell(1, 0 , "V.8.1")
dashboard_cell(1, 1 , trigger ? "Buy" : "Sell", true), dashboard_cell_bg(1, 1, trigger ? color.green : color.red)
dashboard_cell(1, 2 , emaBull ? "Bullish" : "Bearish", true), dashboard_cell_bg(1, 2, emaBull ? color.green : color.red)
dashboard_cell(1, 3 , str.tostring(volume))
dashboard_cell(1, 4 , "Trends")
dashboard_cell(1, 5 , TF1Bull ? "Bullish" : "Bearish", true), dashboard_cell_bg(1, 5 , TF1Bull ? color.green : color.red)
dashboard_cell(1, 6 , TF3Bull ? "Bullish" : "Bearish", true), dashboard_cell_bg(1, 6 , TF3Bull ? color.green : color.red)
dashboard_cell(1, 7 , TF5Bull ? "Bullish" : "Bearish", true), dashboard_cell_bg(1, 7 , TF5Bull ? color.green : color.red)
dashboard_cell(1, 8 , TF15Bull ? "Bullish" : "Bearish", true), dashboard_cell_bg(1, 8 , TF15Bull ? color.green : color.red)
dashboard_cell(1, 9 , TF30Bull ? "Bullish" : "Bearish", true), dashboard_cell_bg(1, 9 , TF30Bull ? color.green : color.red)
dashboard_cell(1, 10, TF60Bull ? "Bullish" : "Bearish", true), dashboard_cell_bg(1, 10, TF60Bull ? color.green : color.red)
dashboard_cell(1, 11, TF120Bull ? "Bullish" : "Bearish", true), dashboard_cell_bg(1, 11, TF120Bull ? color.green : color.red)
dashboard_cell(1, 12, TF240Bull ? "Bullish" : "Bearish", true), dashboard_cell_bg(1, 12, TF240Bull ? color.green : color.red)
dashboard_cell(1, 13, TF480Bull ? "Bullish" : "Bearish", true), dashboard_cell_bg(1, 13, TF480Bull ? color.green : color.red)
dashboard_cell(1, 14, TFDBull ? "Bullish" : "Bearish", true), dashboard_cell_bg(1, 14, TFDBull ? color.green : color.red)
plot(showRevBands ? upperKC1 : na, "Rev.Zone Upper 1", red30)
plot(showRevBands ? upperKC2 : na, "Rev.Zone Upper 2", red30)
plot(showRevBands ? upperKC3 : na, "Rev.Zone Upper 3", red30)
plot(showRevBands ? upperKC4 : na, "Rev.Zone Upper 4", red30)
plot(showRevBands ? lowerKC4 : na, "Rev.Zone Lower 4", cyan30)
plot(showRevBands ? lowerKC3 : na, "Rev.Zone Lower 3", cyan30)
plot(showRevBands ? lowerKC2 : na, "Rev.Zone Lower 2", cyan30)
plot(showRevBands ? lowerKC1 : na, "Rev.Zone Lower 1", cyan30)
fill(plot(showRibbon ? ribbon1 : na, "", na, editable=false), plot(showRibbon ? ribbon2 : na, "", na, editable=false), ribbon1 > ribbon2 ? cyan30 : pink30, "Ribbon Fill Color")
// Alarmlar
alert01 = ta.crossover(ribbon1, ribbon2)
alert02 = bull
alert03 = wtDivBull
alert04 = wtDivBear
alert05 = bull or bear
alert06 = ta.crossover(wt1, wt2) and wt2 <= -53
alert07 = ta.crossunder(wt1, wt2) and wt2 >= 53
alert08 = ta.crossunder(ribbon1, ribbon2)
alert09 = rsiOb or rsiOs
alert10 = bear
alert11 = ta.cross(ribbon1, ribbon2)
alerts(sym) =>
if alert02 or alert03 or alert04 or alert06 or alert07 or alert10
alert_text = alert02 ? "Buy Signal EzAlgo" : alert03 ? "Strong Buy Signal EzAlgo" : alert04 ? "Strong Sell Signal EzAlgo" : alert06 ? "Mild Buy Signal EzAlgo" : alert07 ? "Mild Sell Signal EzAlgo" : "Sell Signal EzAlgo"
alert(alert_text, alert.freq_once_per_bar_close)
alerts(syminfo.tickerid)
alertcondition(alert01, "Blue Trend Ribbon Alert", "Blue Trend Ribbon, TimeFrame={{interval}}")
alertcondition(alert02, "Buy Signal", "Buy Signal EzAlgo")
alertcondition(alert03, "Divergence Buy Alert", "Strong Buy Signal EzAlgo, TimeFrame={{interval}}")
alertcondition(alert04, "Divergence Sell Alert", "Strong Sell Signal EzAlgo, TimeFrame={{interval}}")
alertcondition(alert05, "Either Buy or Sell Signal", "EzAlgo Signal")
alertcondition(alert06, "Mild Buy Alert", "Mild Buy Signal EzAlgo, TimeFrame={{interval}}")
alertcondition(alert07, "Mild Sell Alert", "Mild Sell Signal EzAlgo, TimeFrame={{interval}}")
alertcondition(alert08, "Red Trend Ribbon Alert", "Red Trend Ribbon, TimeFrame={{interval}}")
alertcondition(alert09, "Reversal Signal", "Reversal Signal")
alertcondition(alert10, "Sell Signal", "Sell Signal EzAlgo")
alertcondition(alert11, "Trend Ribbon Color Change Alert", "Trend Ribbon Color Change, TimeFrame={{interval}}")

Dynamic MAs Zscore | Lyro RSThe Dynamic MAs Zscore is an adaptive momentum and valuation oscillator built around advanced moving averages and statistical Z-Score normalization. By combining a wide selection of moving average types with dynamic deviation bands, this indicator delivers clear insights into trend strength , directional bias , and relative valuation — all in a clean, visually intuitive format.
━━━━━━━━━━━━━━━
Key Features
━━━━━━━━━━━━━━━
Dynamic Moving Average Engine
Applies one of 12 selectable moving average types (SMA, EMA, WMA, VWMA, HMA, ALMA, TEMA, etc.) to the chosen source. This allows fine-tuning between responsiveness and smoothness depending on market conditions.
Z-Score Normalization
Transforms the selected moving average into a standardized Z-Score:
(MA − mean) / standard deviation
This normalization makes momentum strength comparable across assets and timeframes.
Adaptive Deviation Bands
Upper and lower bands are derived from the rolling standard deviation of the Z-Score:
Custom band length
Independent positive and negative multipliers
These bands dynamically expand and contract with volatility.
Dual Signal Modes
Trend Mode – Focuses on directional continuation. Color changes and signals occur when Z-Score breaks above or below deviation bands.
Valuation Mode – Highlights relative overvaluation and undervaluation using a gradient color scale and predefined value zones.
Advanced Visual System
Includes bold layered plots, gradient fills, background shading, and candle/bar coloring to clearly reflect current market state.
Custom Color Palettes
Choose from multiple preset themes (Classic, Mystic, Accented, Royal) or define your own bullish and bearish colors.
━━━━━━━━━━━━━━━
How It Works
━━━━━━━━━━━━━━━
MA Calculation – The selected moving average type is applied to the chosen price source.
Z-Score Computation – The MA is normalized over a user-defined lookback period to quantify deviation from its mean.
Band Construction – Standard deviation of the Z-Score is calculated over the band length and scaled by positive/negative multipliers.
Mode-Dependent Logic
Trend Mode – Breaks above the upper band signal bullish momentum; breaks below the lower band signal bearish momentum.
Valuation Mode – A gradient reflects relative valuation from undervalued to overvalued, with background highlights at extreme Z-Score levels.
━━━━━━━━━━━━━━━
Signal Interpretation
━━━━━━━━━━━━━━━
Trend Confirmation
In Trend Mode, sustained moves beyond deviation bands indicate strong directional bias.
Momentum Strength
The distance of the Z-Score from zero reflects the intensity of trend momentum.
Relative Valuation
In Valuation Mode, deep negative Z-Scores suggest undervaluation, while high positive Z-Scores suggest overvaluation.
Visual Clarity
Bar and candle coloring aligned with oscillator state allows for rapid assessment of market conditions.
━━━━━━━━━━━━━━━
Customization
━━━━━━━━━━━━━━━
Adjust MA type and length to balance speed vs. smoothness.
Modify Z-Score length to control sensitivity.
Tune band length and multipliers for volatility adaptation.
Switch between Trend and Valuation modes depending on strategy.
Personalize visuals using preset or custom color palettes.
━━━━━━━━━━━━━━━
Alerts
━━━━━━━━━━━━━━━
Bullish condition when Z-Score > 0
Bearish condition when Z-Score < 0
Overvalued and undervalued valuation alerts
⚠️ Disclaimer
This indicator is intended for technical analysis and educational purposes only. It does not guarantee profitable outcomes and should be used alongside other tools, confirmation methods, and sound risk management. The author is not responsible for any financial decisions made using this indicator.

VWAP Flow ParmezanThe "Official Bank Flow VWAP" is a comprehensive trading suite designed for institutional Forex traders.
This indicator solves the problem of chart clutter by combining two critical components of liquidity: Price (Value) and Time (Sessions). It is specifically optimized for EUR/USD and GBP/USD on intraday timeframes (M5, M15), helping you identify high-probability setups where "Fair Value" meets "Volatility."
Key Features
1. Multi-Timeframe VWAP Hierarchy Unlike standard indicators, this tool visualizes the interaction between three distinct timeframes:
Daily VWAP (Dynamic Color): Your primary trend filter. Green when Bullish (Price > VWAP), Red when Bearish (Price < VWAP).
Weekly VWAP (Orange Dots): Represents the medium-term balance. Acts as a magnet for mean reversion mid-week.
Monthly VWAP (Purple Line): The institutional "line in the sand." Major support/resistance level.
2. Standard Deviation Bands (Market Balance) The indicator plots SD1 and SD2 bands around the Daily VWAP:
Inner Zone (SD1): Represents the "Fair Value" area.
Outer Bands (SD2): Represents overbought/oversold conditions. Useful for identifying mean reversion plays back to the center.
3. Official Exchange Sessions (Time) Forget confusing "killzones." This tool highlights the Official Open times for major exchanges, adjusted for Daylight Savings via New York time:
London Open (08:00 LDN): The start of European volume.
New York Open (08:00 NY): The injection of US liquidity.
London Close/Fix: The daily overlap close, often marking trend reversals.
Note: Sessions are visualized with non-intrusive black "shadow" backgrounds to keep your chart clean.
4. "Ghost" Levels (Previous VWAP) A unique feature that plots the closing VWAP level of the previous day. Institutional algorithms often target these "untested" levels as Take Profit targets or liquidity pools.
How to Use
Trend Following: If Price is above the Daily VWAP (Green) during the London Open, look for Long entries targeting the SD1/SD2 upper bands.
Mean Reversion: If Price hits the SD2 Band while far away from the Weekly VWAP, look for a reversal back to the mean.
Confluence: The strongest signals occur when price touches a key VWAP level (e.g., Weekly VWAP) specifically during the highlighted Session Start times.
Settings
Timezone: Defaults to America/New_York to automatically handle DST shifts for London/NY opens.
Visuals: Fully customizable colors and transparency. Default is set to a "Dark Mode" friendly professional palette.

AlgoZ Smart Divergence [Trend Filtered]AlgoZ Smart Divergence is a precision entry tool designed to catch market reversals by analyzing Volume Divergence combined with Multi-Timeframe Trend Filtering. Unlike standard divergence indicators that signal on every minor price fluctuation, this script uses a strict set of filters to only present high-probability trade setups that align with the broader market trend.
This is the Free Edition of the AlgoZ Suite, focused on providing clean, non-repainting Buy and Sell signals based on institutional volume flow.
How It Works The script operates on a 3-step validation process:
Volume Divergence:
It detects anomalies where volume spikes relative to price action (e.g., Price makes a Lower Low, but Volume hits a Higher High).
HTF Trend Painting:
It analyzes a Higher Timeframe (Default: 3 Hours) to determine the macro trend. If the 3H trend is Bullish, the candles turn Green. If Bearish, they turn Red.
Color Match Filtering:
The script includes a smart filter that blocks signals that go against the trend. You will only see BUY signals when the candles are Green (Uptrend) and SELL signals when the candles are Red (Downtrend).
Key Features
Volume Divergence Engine:
Identifies hidden accumulation and distribution zones.
HTF Trend Coloring:
Automatically paints your chart based on Higher Timeframe breakouts (Default: 3-Hour Trend).
Smart Signal Filtering:
Toggles are available to "Only Show Signals Matching Candle Color," ensuring you never trade against the momentum.
EMA Trend Filter:
Includes a built-in 10-period EMA filter to further refine entries.
Volatility Filters:
Optional RSI and ADX filters are included to avoid trading during low-volatility "chop."
How to Use
For Longs (Buys):
Wait for the candles to turn Green (indicating the 3-Hour trend is up) and look for a BUY label. The price must also be above the 10 EMA (if enabled).
For Shorts (Sells):
Wait for the candles to turn Red (indicating the 3-Hour trend is down) and look for a SELL label.
Risk Management:
This script is designed to catch reversals. Always place your Stop Loss below the recent swing low (for buys) or above the swing high (for sells).
Settings
Higher Timeframe:
Default is set to 3 Hours (180 minutes). You can adjust this to 1 Day or 4 Hours depending on your trading style.
EMA Length:
Default is 10.
Color Match Filter:
On by default.

Auto Trend [theUltimator5]The Auto Trend indicator was designed to be a unique pattern detection indicator without the use of standard pivot point logic or high/low lines. It is a study in pattern detection by using iterative best-fit logic.
The indicator automatically identifies and draws trend channels by analyzing price action across configurable lookback periods. It finds optimal high and low trendlines that contain price movement, with a middle line marking the trend's center.
Key Features:
Automatic Pattern Detection - Intelligently searches for the best lookback period where price stays within the channel boundaries
Dual Pattern Modes - Choose between Short (20-66 bars) for quick patterns or Long (50-500 bars) for extended trends. Note - the long pattern is fully configurable and can be set anywhere up to 5000 bars.
Smart Caching - Optimized performance that only recalculates when necessary
Customizable Starting Point - Click directly on the chart to set where the trend channel begins
Flexible Lookback Range - Set minimum and maximum lookback periods to match your trading style
Visual Debugging - Optional label displays the active lookback period and violation count
How It Works:
The indicator divides the lookback period into thirds, finds the highest and lowest closes in the first and last thirds, then draws trendlines connecting these points. It can automatically search through different lookback periods to find the one with the fewest price violations (closes outside the channel).
Settings:
Use Auto Lookback - Enable automatic optimal lookback detection
Pattern Length - Short (faster, 1-bar increments) or Long (broader, 5-bar increments)
Min/Max Lookback - Define the search range for the Long pattern
Manual Lookback - Override auto-detection with a fixed period
Custom Colors - Personalize the high, low, and middle line colors
Starting Point - Select where the trend analysis begins
Use Cases:
Identify dominant trend channels across different timeframes
Spot potential support and resistance levels
Determine trend strength and consistency
Time entries and exits based on channel position
The indicator supports up to 5000 bars of historical data for comprehensive trend analysis.

Clean Volume (SUV)The Problem with Raw Volume
Traditional volume bars tell you how much traded, but not whether that amount is unusual. This creates noise that misleads traders:
Stock A averages 1M shares with wild daily swings (500K-2M is normal). Today's 2M volume looks like a spike—but it's just a routine high day.
Stock B averages 1M shares with rock-steady volume (950K-1.05M typical). Today's 2M volume is genuinely extraordinary—institutions are clearly active.
Both show identical 200% relative volume. But Stock B's reading is far more significant. Raw volume and simple relative volume (RVol) can't distinguish between these situations, leading to:
- False signals on naturally volatile stocks
- Missed signals on stable stocks where smaller deviations matter
- Inconsistent comparisons across different securities
---
A Solution: Standardized Unexpected Volume (SUV)
SUV applies statistical normalization to volume, measuring how many standard deviations today's volume is from the mean. This z-score approach accounts for each stock's individual volume stability, not just its average.
SUV = (Today's Volume - Average Volume) / Standard Deviation of Volume
Using the examples above:
- Stock A (high volatility): SUV = 2.0 — elevated but not unusual for this stock
- Stock B (low volatility): SUV = 10.0 — extremely unusual, demands attention
SUV automatically calibrates to each security's behaviour, making volume readings comparable across any stock, ETF, or timeframe.
---
What SUV Is Good For
✅ Identifying genuine volume anomalies — separates signal from noise
✅ Comparing volume across different securities — apples-to-apples z-scores
✅ Spotting institutional activity — large players create statistically significant footprints
✅ Confirming breakouts — high SUV validates price moves
✅ Detecting exhaustion — extreme SUV after extended moves may signal climax
✅ Finding "dry" setups — negative SUV reveals quiet accumulation periods
---
Where SUV Has Limitations
⚠️ Earnings/news events — SUV will spike dramatically (by design), but the statistical reading may be less meaningful when fundamentals change
⚠️ Low-float stocks — extreme volume volatility can produce erratic SUV readings
⚠️ First 20 bars — needs lookback period to establish baseline; early readings are less reliable
⚠️ Doesn't predict direction — SUV measures volume intensity, not whether price will rise or fall
---
How to Read This Indicator
Bar Height
Displays actual volume (like a traditional volume chart) so you can still see absolute levels.
Bar Color (SUV Intensity)
Color intensity reflects the SUV z-score. Brighter = more unusual.
Up Days (Green Gradient):
| Color | SUV Range | Meaning |
|--------------|-----------|------------------------------------------|
| Bright Green | ≥ 3.0 | EXTREME — Highly unusual buying activity |
| Green | ≥ 2.0 | VERY HIGH — Significant accumulation |
| Light Green | ≥ 1.5 | HIGH — Above-average interest |
| Pale Green | ≥ 1.0 | ELEVATED — Moderately active |
| Muted Green | 0 to 1.0 | NORMAL — Typical volume |
| Dark Grey | < 0 | DRY — Below-average, quiet |
Down Days (Red Gradient):
| Color | SUV Range | Meaning |
|------------|-----------|-----------------------------------------|
| Bright Red | ≥ 3.0 | EXTREME — Panic selling or capitulation |
| Red | ≥ 2.0 | VERY HIGH — Heavy distribution |
| Light Red | ≥ 1.5 | HIGH — Active selling |
| Pale Red | ≥ 1.0 | ELEVATED — Moderate selling |
| Muted Red | 0 to 1.0 | NORMAL — Routine down day |
| Dark Grey | < 0 | DRY — Light profit-taking |
Coiled State (Tan/Beige):
When detected, bars turn muted tan regardless of direction. This indicates:
- Volume compression (SUV below threshold for consecutive days)
- Volatility contraction (ATR below average)
- Price tightness (small recent moves)
Coiled states may precede significant breakouts.
Special Markers
"P" Label (Blue) — Pocket Pivot detected. Morales & Kacher's signal fires when:
- Price closes higher than previous close
- Price closes above the open (green candle)
- Volume exceeds the highest down-day volume of the last 10 bars
Pocket Pivots may indicate institutional buying before a traditional breakout.
"C" Label (Orange) — Coiled state confirmed. The stock is consolidating with compressed volume and tight price action. Watch for expansion.
Dashboard
The configurable dashboard displays real-time metrics. Default items:
- Vol — Current bar volume
- SUV — Z-score value
- Class — Classification (EXTREME/VERY HIGH/HIGH/ELEVATED/NORMAL/DRY/COILED)
- Proj RVol — Projected end-of-day relative volume (intraday only)
Additional optional items: Direction, Coil Status, Relative ATR, Pocket Pivot, Average Volume.
---
Practical Usage Tips
1. SUV ≥ 2 on breakouts — Validates the move has institutional participation
2. Watch for SUV < 0 bases — Quiet accumulation zones where smart money builds positions
3. Coil → Expansion — After consecutive coiled days, the first SUV ≥ 1.5 bar often signals direction
4. Pocket Pivots in bases — Early accumulation signals before price breaks out
5. Extreme SUV (≥3) after extended moves — May indicate climax/exhaustion rather than continuation
---
Settings Overview
| Group | Key Settings |
|-----------------|-----------------------------------------------------|
| SUV Settings | Lookback period (default 20) |
| Coil Detection | Enable/disable, sensitivity thresholds |
| Pocket Pivot | Enable/disable, lookback period |
| Display | Dashboard style (Ribbon/Table), position, text size |
| Dashboard Items | Toggle which metrics appear |
| Colors | Fully customizable gradient colors |
---
Credits
SUV concept adapted from academic literature on standardized unexpected volume in market microstructure research. Pocket Pivot methodology based on Gil Morales and Chris Kacher's work. Coil detection inspired by volatility contraction patterns.
---
This indicator does not provide financial advice. Always combine volume analysis with price action, market context, and proper risk management. No animals were harmed during the coding and testing of this indicator.

Short-Term Bubble Risk [Phantom] Short-Term Bubble Risk
Concept
This indicator visualizes short-term market risk by measuring how far price is stretched relative to its recent weekly trend.
Instead of focusing on absolute price levels, it looks at price behavior.
A similar reading means similar market conditions, whether price is high or low.
The goal is to help identify areas of potential accumulation and potential distribution in a clear, visual way.
How It Works
The indicator compares the weekly closing price to a weekly moving average and displays the deviation as a histogram.
When price is far below its average, risk is considered lower
When price is far above its average, risk is considered higher
The zero line represents fair value, where price equals its weekly average.
Features
Color-coded histogram showing short-term risk levels
Designed to work across different assets and price ranges
Optional bar coloring on the main chart using weekly risk data
Safe to use on any timeframe (risk is calculated on weekly data)
Settings
# Moving Average Length (Weeks):
Adjusts how sensitive the indicator is to price changes
# Color Visibility Toggles:
Allows hiding or showing specific risk zones
# Bar Coloring:
Option to color chart candles based on weekly risk levels
Usage
This indicator is best used as a risk lens, not a timing tool.
Common uses include:
Identifying potential accumulation zones during weakness
Spotting overextended conditions during strong moves
Comparing short-term risk across different assets
Adding context to trend-following or DCA strategies
Trade Ideas
# Lower-risk zones (cool colors):
Can support accumulation or patience during downtrends
# Higher-risk zones (warm colors):
Can signal caution, reduced exposure, or profit-taking
Always combine with:
Trend direction
Market structure
Higher-timeframe context
Limitations
This indicator does not predict tops or bottoms
High risk can remain high during strong trends
Low risk does not guarantee immediate reversals
It should not be used as a standalone trading system.
Disclaimer
This indicator is for educational and informational purposes only.
It is not financial advice.
Always do your own research and manage risk appropriately.

ORB Strategy + Backtesting (fixed timestamp) - Lines Adjusted⚡ ORB Strategy + Backtesting (Pine Script v5)
This script implements a complete Opening Range Breakout (ORB) strategy, featuring built-in backtesting, advanced TP/SL visualization, full style customization, and a performance dashboard. It is designed for traders who want to clearly evaluate breakout performance directly on the chart.
🕑 ORB Window Configuration
🔹 Session selection: choose between Market Timezone or Custom Session.
🔹 Timezone support: configurable from UTC-8 to UTC+12.
🔹 Daily limit: option to allow only one trade per day.
🔹 Risk/Reward (RR) settings:
Configurable TP1, TP2, and TP3 levels.
Stop Loss calculated dynamically from the ORB range.
📊 Backtesting Engine
🔹 Interactive dashboard showing trades, wins, losses, and win rate.
🔹 Adjustable partial exits for each TP (TP1, TP2, TP3).
🔹 Automatic calculation of percentage-based profit and loss.
🔹 Tracks total trades, total profit, and average profit per trade.
🎨 Visual Customization
🔹 Fully customizable colors:
ORB high/low lines and range fill.
Buy/Sell entry labels.
TP and SL lines with background zones.
🔹 Line style and thickness options (solid, dotted, dashed).
🔹 Visibility controls for each TP/SL level.
🔹 Clear profit and loss zones drawn directly on the chart.
🚀 Trading Logic
🔹 LONG entries: triggered when price breaks above the ORB high.
🔹 SHORT entries: triggered when price breaks below the ORB low.
🔹 Automatic calculation of Stop Loss and TP1, TP2, TP3 based on ORB range and RR.
🔹 Customizable BUY / SELL labels displayed at entry.
✅ TP / SL Detection
🔹 Real-time detection of TP1, TP2, TP3, and SL hits.
🔹 Prevents double counting of the same level.
🔹 Extended TP/SL lines with shaded zones for better clarity.
📈 Backtesting Dashboard
🔹 Displayed in the top-right corner of the chart.
🔹 Shows:
Total trades
Wins / Losses
Win rate (%)
Total profit (%)
Average profit per trade
🔹 Fully customizable panel color.
✨ Summary
This script combines:
Opening Range detection
Breakout trading logic with advanced risk management
Professional-grade visualizations
Integrated historical performance tracking
High customization for sessions, styles, and colors
💡 Ideal for traders who want to trade ORB setups with clarity, structure, and measurable results.

Victor aimstar past strategy -v1Introducing the ultimate all-in-one DIY strategy builder indicator, With over 30+ famous indicators (some with custom configuration/settings) indicators included, you now have the power to mix and match to create your own custom strategy for shorter time or longer time frames depending on your trading style. Say goodbye to cluttered charts and manual/visual confirmation of multiple indicators and hello to endless possibilities with this indicator.
What it does
==================
This indicator basically help users to do 2 things:
1) Strategy Builder
With more than 30 indicators available, you can select any combination you prefer and the indicator will generate buy and sell signals accordingly. Alternative to the time-consuming process of manually confirming signals from multiple indicators! This indicator streamlines the process by automatically printing buy and sell signals based on your chosen combination of indicators. No more staring at the screen for hours on end, simply set up alerts and let the indicator do the work for you.

Hull MA Al-Sat/@version=6
indicator("Hull MA Al-Sat", overlay=true, max_lines_count=500, max_labels_count=500)
// Kullanıcı girişi
length = input.int(21, "HMA Periyodu")
hma_source = input.source(close, "HMA Kaynağı")
plotThickness = input.int(3, "Çizgi Kalınlığı")
// HMA hesaplama
wma1 = ta.wma(hma_source, math.round(length / 2))
wma2 = ta.wma(hma_source, length)
diff = 2 * wma1 - wma2
hma = ta.wma(diff, math.round(math.sqrt(length)))
// Renkli çizgi
hmaColor = hma > hma ? color.green : color.red
plot(hma, color=hmaColor, linewidth=plotThickness)
// Al/Sat okları
plotshape(ta.crossover(hma, hma ), title="Al", location=location.belowbar, color=color.green, style=shape.triangleup, size=size.large)
plotshape(ta.crossunder(hma, hma ), title="Sat", location=location.abovebar, color=color.red, style=shape.triangledown, size=size.large)
