PROTECTED SOURCE SCRIPT
Güncellendi Quarterly Theory True Opens by Mr. Consistent
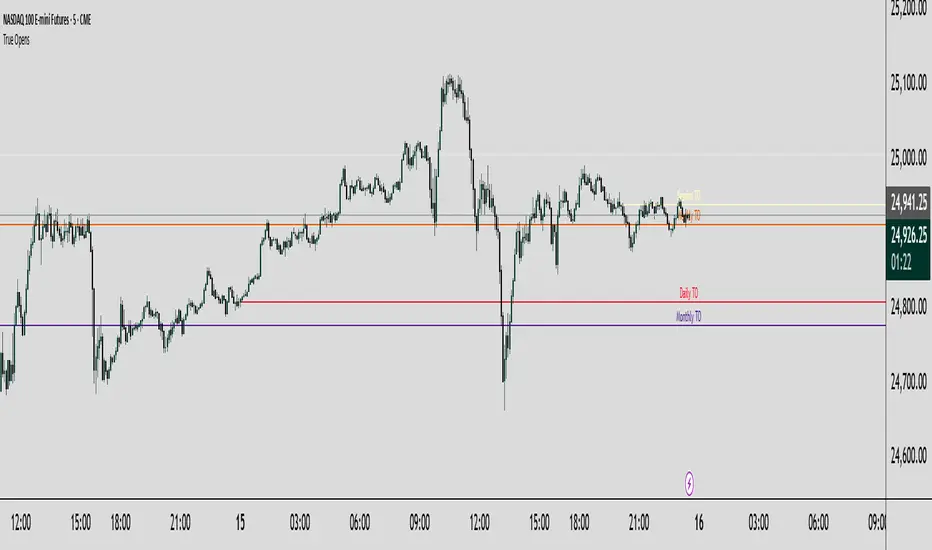
Quarterly Theory True Opens (MTF)
This indicator plots key institutional price levels known as "True Opens" based on the principles of Quarterly Theory, as taught by Trader Daye. It is designed to identify the start of Q2 manipulation cycles across yearly, monthly, weekly, daily, and intra-day session timeframes.
The levels are drawn as clean horizontal rays and are anchored to the 1-minute timeframe, ensuring they are perfectly accurate and consistent on ANY chart timeframe you view.
🎯 Core Concepts
Each line represents the "True Open" at the start of a new Q2 cycle:
📅 Yearly True Open: The open of the first trading day of April.
🗓️ Monthly True Open: The open of the second Monday of each month.
Weekly True Open: The open of the Monday 6:00 PM EST session.
🏙️ Daily True Open: The open at Midnight EST.
⏰ Session True Opens: The open at the start of the second 90-minute quarter of each session (1:30 AM, 7:30 AM, 1:30 PM, 7:30 PM EST).
✨ Key Features
Multi-Timeframe (MTF) Accuracy: Lines are anchored to the 1-minute open price, ensuring they remain perfectly consistent on any chart timeframe (e.g., the 7:30 AM open is the same on the 5min, 1-hour, and Daily charts).
Clean Horizontal Rays: Plots clean horizontal rays that extend forward, avoiding chart clutter. Old lines are automatically removed as new ones form.
Right-Aligned Labels: Text labels are positioned on the right edge of your screen, so they are always visible and never covered by price action.
Fully Customizable: Toggle the visibility of each True Open line (Yearly, Monthly, etc.) and their labels individually in the settings. You can also customize colors and line width.
New York (EST) Timezone: All calculations are hard-coded to the America/New_York timezone for consistency.
⚙️ How to Use
Use these levels as key points of interest for potential support, resistance, or areas where price may show a significant reaction.
Observe how price interacts with these levels after they are established.
Customize the indicator in the settings (⚙️ icon) to show only the levels relevant to your trading style.
⚠️ Troubleshooting: Lines Not Showing Correctly?
If the indicator lines don't seem to plot at the correct price levels when you first add it to your chart, it's almost always a scaling issue.
Hover over the indicator's name on your chart and click the three dots (...) for "More".
Scroll down to "Pin to Scale".
Select "Pin to Right Scale" (or whichever scale your price is on). The indicator levels must be pinned to the same scale as the price to display accurately.
If it is set to "No Scale," the levels will not reflect their true price values.
This tool was developed based on the public teachings of Trader Daye. All credit for the underlying concepts of Quarterly Theory belongs to him. This indicator is for educational and analytical purposes only.
Sürüm Notları
### True Opens (MTF) - V2 UpdateThis indicator plots key institutional price levels known as "True Opens" based on the principles of **Quarterly Theory**. It is designed to identify the start of Q2 manipulation cycles across yearly, monthly, weekly, daily, and intra-day session timeframes.
This new version includes major logic updates to ensure the Yearly and Monthly opens plot with mathematical precision, fixing bugs found in the previous version. The levels are anchored to the 1-minute timeframe, ensuring they are perfectly accurate and consistent on **ANY chart timeframe** you view.
---
### 🎯 Core Concepts
Each line represents the "True Open" at the start of a new Q2 cycle. The times have been updated for greater accuracy:
* **📅 Year True Open (TYO):** The open of the bar at **6:00 PM EST** on the **first Monday of April**.
* **🗓️ Month True Open (TMO):** The open of the bar at **6:00 PM EST** on the **second Sunday of each month**.
* **Weekly True Open (TWO):** The open of the bar at **6:00 PM EST every Monday**.
* **🏙️ Day True Open (TDO):** The open of the bar at **12:00 AM (Midnight) EST** every day.
* **⏰ Session True Opens (TSO):** The open at the start of the second 90-minute quarter of each session (1:30 AM, 7:30 AM, 1:30 PM, 7:30 PM EST).
---
### ✨ Key Features
* **Multi-Timeframe (MTF) Accuracy:** Lines are anchored to the 1-minute open price, ensuring they remain perfectly consistent on any chart timeframe (e.g., the 7:30 AM open is the same on the 5min, 1-hour, and Daily charts).
* **Clean Horizontal Rays:** Plots clean horizontal rays that extend forward, avoiding chart clutter. Old lines are automatically removed as new ones form.
* **Right-Aligned Labels:** Text labels are positioned on the right edge of your screen, so they are always visible and never covered by price action.
* **Fully Customizable:** Toggle the visibility of each True Open line (Yearly, Monthly, etc.) and their labels individually in the settings. You can also customize colors and line width.
* **New York (EST) Timezone:** All calculations are hard-coded to the `America/New_York` timezone for consistency.
---
### ⚙️ How to Use
These levels are designed to frame your trades by identifying institutional reference points. A primary strategy is to use them to measure the **Judas Swing**—a false move designed to trap traders before the real move begins.
* **For bearish moves,** look to **sell from above** a key True Open.
* **For bullish moves,** look to **buy from below** a key True Open.
Observe how price interacts with these levels. They often act as key points of interest for significant reactions. Customize the indicator in the settings (⚙️ icon) to show only the levels relevant to your trading style.
---
### ⚠️ Troubleshooting: Lines Not Showing Correctly?
If the indicator lines don't seem to plot at the correct price levels when you first add it to your chart, it's almost always a scaling issue.
1. Hover over the indicator's name on your chart and click the **three dots (...)** for "More".
2. Scroll down to **"Pin to Scale"**.
3. Select **"Pin to Right Scale"** (or whichever scale your price is on). The indicator levels must be pinned to the same scale as the price to display accurately.
If it is set to "No Scale," the levels will not reflect their true price values.
---
*This tool was developed based on the public teachings of Trader Daye. All credit for the underlying concepts of Quarterly Theory belongs to him. This indicator is for educational and analytical purposes only.*
Korumalı komut dosyası
Bu komut dosyası kapalı kaynak olarak yayınlanmaktadır. Ancak, ücretsiz ve herhangi bir sınırlama olmaksızın kullanabilirsiniz – daha fazla bilgiyi buradan edinebilirsiniz.
Feragatname
Bilgiler ve yayınlar, TradingView tarafından sağlanan veya onaylanan finansal, yatırım, alım satım veya diğer türden tavsiye veya öneriler anlamına gelmez ve teşkil etmez. Kullanım Koşulları bölümünde daha fazlasını okuyun.