OPEN-SOURCE SCRIPT
Volume Highlight
Volume Highlight
Description:
This script helps users analyze trading volume by:
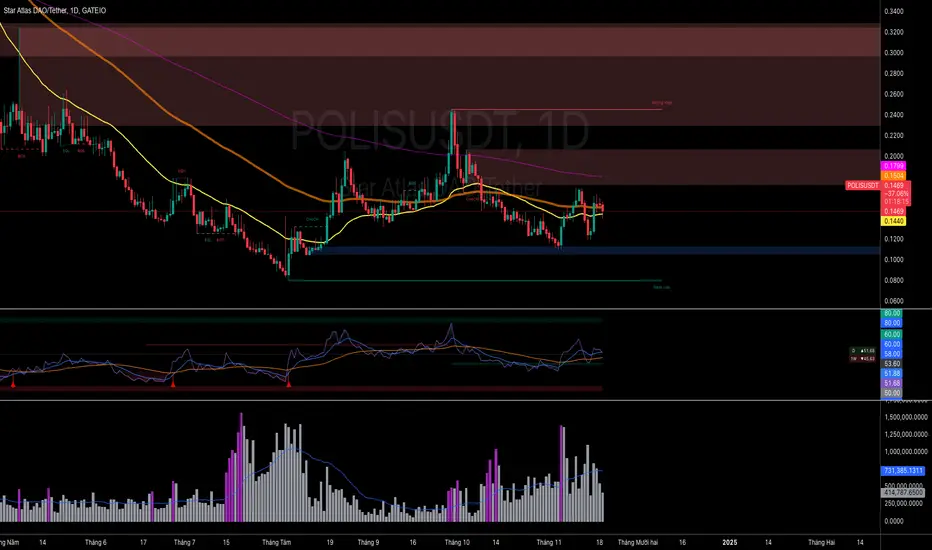
1. Highlighting the highest volume bars:
• Trading sessions with volume equal to or exceeding the highest value over the last 20 periods are displayed in purple.
• Other sessions are displayed in light gray.
2. Displaying the 20-period SMA (Simple Moving Average):
• A 20-period SMA line of the volume is included to track the general trend of trading volume.
Key Features:
• Color-coded Highlights:
• Quickly identify trading sessions with significant volume spikes.
• 20-Period SMA Line:
• Observe the overall trend of trading volume.
• Intuitive Volume Bars:
• Volume bars are clearly displayed for easy interpretation.
How to Use:
1. Add the script to your chart on TradingView.
2. Look at the color of the volume bars:
• Purple: Sessions with the highest trading volume in the past 20 periods.
• Light gray: Other sessions.
3. Use the 20-period SMA line to analyze volume trends.
Purpose:
• Analyze market momentum through trading volume.
• Support trading decisions by identifying significant volume spikes.
Illustration:
• A chart showing color-coded volume bars and the 20-period SMA line.
Description:
This script helps users analyze trading volume by:
1. Highlighting the highest volume bars:
• Trading sessions with volume equal to or exceeding the highest value over the last 20 periods are displayed in purple.
• Other sessions are displayed in light gray.
2. Displaying the 20-period SMA (Simple Moving Average):
• A 20-period SMA line of the volume is included to track the general trend of trading volume.
Key Features:
• Color-coded Highlights:
• Quickly identify trading sessions with significant volume spikes.
• 20-Period SMA Line:
• Observe the overall trend of trading volume.
• Intuitive Volume Bars:
• Volume bars are clearly displayed for easy interpretation.
How to Use:
1. Add the script to your chart on TradingView.
2. Look at the color of the volume bars:
• Purple: Sessions with the highest trading volume in the past 20 periods.
• Light gray: Other sessions.
3. Use the 20-period SMA line to analyze volume trends.
Purpose:
• Analyze market momentum through trading volume.
• Support trading decisions by identifying significant volume spikes.
Illustration:
• A chart showing color-coded volume bars and the 20-period SMA line.
Açık kaynak kodlu komut dosyası
Gerçek TradingView ruhuyla, bu komut dosyasının mimarı, yatırımcıların işlevselliğini inceleyip doğrulayabilmesi için onu açık kaynaklı hale getirdi. Yazarı tebrik ederiz! Ücretsiz olarak kullanabilseniz de, kodu yeniden yayınlamanın Topluluk Kurallarımıza tabi olduğunu unutmayın.
Feragatname
Bilgiler ve yayınlar, TradingView tarafından sağlanan veya onaylanan finansal, yatırım, alım satım veya diğer türden tavsiye veya öneriler anlamına gelmez ve teşkil etmez. Kullanım Koşulları bölümünde daha fazlasını okuyun.