OPEN-SOURCE SCRIPT
Realized Volatility (StdDev of Returns, %)
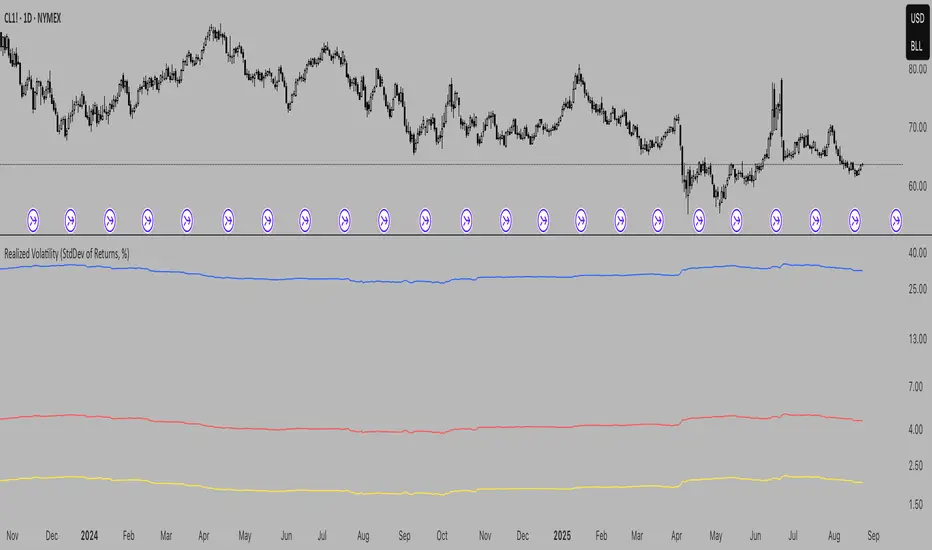
Realized Volatility (StdDev of Returns, %)
This indicator measures realized (historical) volatility by calculating the standard deviation of log returns over a user-defined lookback period. It helps traders and analysts observe how much the price has varied in the past, expressed as a percentage.
How it works:
Provides three volatility measures:
Inputs:
Notes:
This indicator measures realized (historical) volatility by calculating the standard deviation of log returns over a user-defined lookback period. It helps traders and analysts observe how much the price has varied in the past, expressed as a percentage.
How it works:
- Computes close-to-close logarithmic returns.
- Calculates the standard deviation of these returns over the selected lookback window.
Provides three volatility measures:
- Daily Volatility (%): Standard deviation over the chosen period.
- Annualized Volatility (%): Scaled using the square root of the number of trading days per year (default = 250).
- Horizon Volatility (%): Scaled to a custom horizon (default = 5 days, useful for short-term views).
Inputs:
- Lookback Period: Number of bars used for volatility calculation.
- Trading Days per Year: Used for annualizing volatility.
- Horizon (days): Adjusts volatility to a shorter or longer time frame.
Notes:
- This is a statistical measure of past volatility, not a forecasting tool.
- If you change the scale to logarithmic, the indicator readibility improves.
- It should be used for analysis in combination with other tools and not as a standalone signal.
Açık kaynak kodlu komut dosyası
Gerçek TradingView ruhuyla, bu komut dosyasının mimarı, yatırımcıların işlevselliğini inceleyip doğrulayabilmesi için onu açık kaynaklı hale getirdi. Yazarı tebrik ederiz! Ücretsiz olarak kullanabilseniz de, kodu yeniden yayınlamanın Topluluk Kurallarımıza tabi olduğunu unutmayın.
Feragatname
Bilgiler ve yayınlar, TradingView tarafından sağlanan veya onaylanan finansal, yatırım, alım satım veya diğer türden tavsiye veya öneriler anlamına gelmez ve teşkil etmez. Kullanım Koşulları bölümünde daha fazlasını okuyun.