PROTECTED SOURCE SCRIPT
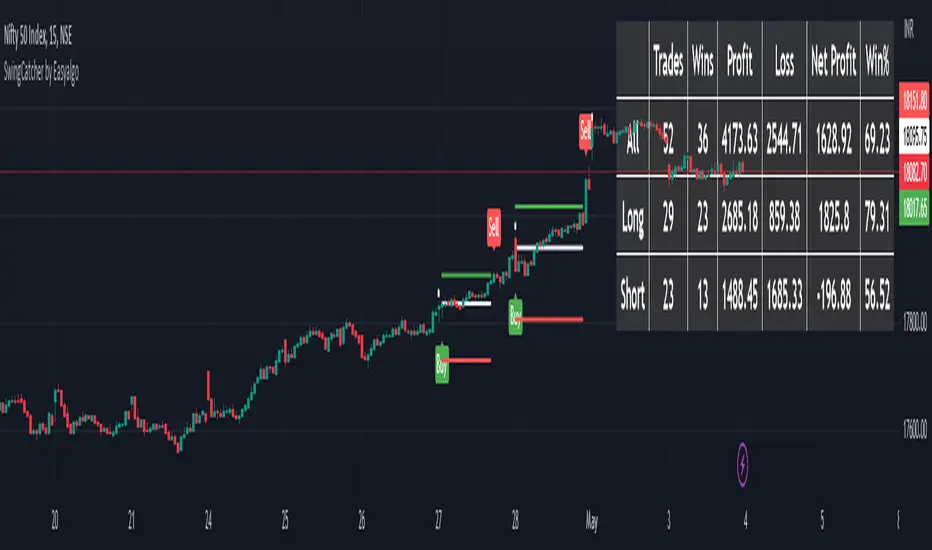
SwingCatcher by Easyalgo
Author :- Shashank
Contact - +91-8448735946
Email :- Support@easyalgo.in
This trading strategy uses three different patterns to identify potential trade setups. Here is a brief summary of each pattern:
Note: For better result use HA candle NSE:NIFTY
Bullish Engulfing Pattern: This pattern occurs when the current day's high is higher than the previous day's high and the current day's low is lower than the previous day's low. This suggests that the bulls have taken control of the market and that a bullish trend may be forming.
Bearish Engulfing Pattern: This pattern occurs when the current day's high is lower than the previous day's high and the current day's low is higher than the previous day's low. This suggests that the bears have taken control of the market and that a bearish trend may be forming.
Bullish Trend Pattern: This pattern looks for a specific set of price and volume conditions that suggest a bullish trend. Specifically, it looks for three consecutive days where the closing price is higher than the opening price, and where the closing price on the current day is higher than the high price on the two previous days. This suggests that the market is in a bullish trend and that it may be a good time to enter a long position.
The script allows the user to select which patterns to use by setting boolean switches (pattern_1_switch, pattern_2_switch, and pattern_3_switch) to true or false. By default, all three patterns are enabled.
Korumalı komut dosyası
Bu komut dosyası kapalı kaynak olarak yayınlanmaktadır. Ancak, ücretsiz ve herhangi bir sınırlama olmaksızın kullanabilirsiniz – daha fazla bilgiyi buradan edinebilirsiniz.
Feragatname
Bilgiler ve yayınlar, TradingView tarafından sağlanan veya onaylanan finansal, yatırım, alım satım veya diğer türden tavsiye veya öneriler anlamına gelmez ve teşkil etmez. Kullanım Koşulları bölümünde daha fazlasını okuyun.