OPEN-SOURCE SCRIPT
Güncellendi X PD&FV
Visualizes the price's premium or discount relative to a moving average benchmark, highlighting mean-reversion and trend-continuation opportunities. While the underlying math is simple, the application is nuanced and can enhance decision-making in both trending and ranging market conditions.
Core Logic:
This tool calculates a custom **spread value**, defined as the distance between the current price and a chosen exponential moving average (EMA). Specifically:
This approach creates a dynamic spread that reflects deviation from the EMA, with histogram bars:
A secondary EMA (default 9-period) is applied to the spread itself, plotted as a smoother line over the histogram. This "EMA of spread" line can be interpreted as a moving reference level for detecting directional shifts in momentum.
Interpretation:
Zero Line = Fair Value: The horizontal zero axis represents equilibrium relative to the moving average. Movement toward or away from this line signals potential shifts in market bias.
Trend Following Use: In trending markets, traders can:
Mean Reversion Use: A return to the zero line (fair value) often acts as an **inflection point**, which traders can monitor for either:
Customization:
EMA length (default 50) is adjustable to fit different timeframes or asset volatility.
Core Logic:
This tool calculates a custom **spread value**, defined as the distance between the current price and a chosen exponential moving average (EMA). Specifically:
- When the current price is **above** the EMA, the spread is calculated as `low - EMA`.
- When the price is **below** the EMA, the spread is calculated as `high - EMA`.
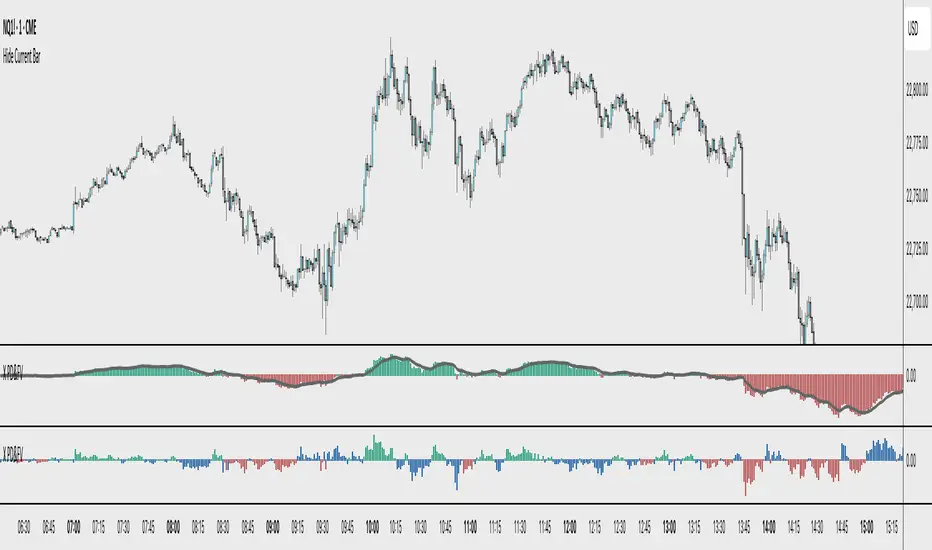
This approach creates a dynamic spread that reflects deviation from the EMA, with histogram bars:
- Green when the spread is positive (suggesting a price premium),
- Red when the spread is negative (suggesting a discount).
A secondary EMA (default 9-period) is applied to the spread itself, plotted as a smoother line over the histogram. This "EMA of spread" line can be interpreted as a moving reference level for detecting directional shifts in momentum.
Interpretation:
Zero Line = Fair Value: The horizontal zero axis represents equilibrium relative to the moving average. Movement toward or away from this line signals potential shifts in market bias.
Trend Following Use: In trending markets, traders can:
- Buy when the spread dips below its EMA (discount within uptrend),
- Sell when the spread rises above its EMA (premium within downtrend).
Mean Reversion Use: A return to the zero line (fair value) often acts as an **inflection point**, which traders can monitor for either:
- Trend continuation (bounce away from zero), or
- Reversal (cross through zero).
Customization:
EMA length (default 50) is adjustable to fit different timeframes or asset volatility.
Sürüm Notları
Supplemental Feature: Trade Timing Zones with Momentum ConfirmationThe latest enhancement introduces a second histogram that measures the deviation of the spread from its own EMA (ema01_spread - ema01_of_ema01). This creates a higher-order view of momentum within the price deviation signal itself.
Key Interpretive Layer:
The bars are colored green or red depending on whether the deviation is positive or negative, indicating momentum direction of the spread relative to its own average.
A third color (blue) is introduced based on slope logic of the base EMA:
When price deviation is rising against the slope of the underlying EMA, or falling with it, bars are blue.
These blue bars highlight key decision zones where price behavior becomes more ambiguous or transitional.
Strategic Use:
Blue zones mark moments where the current move conflicts with or resets against the trend. These are optimal areas to:
Initiate a new position (long or short), with the intent to confirm direction.
Wait for follow-through before scaling in, allowing the market to show continuation.
Fade the prevailing move if blue resolves counter to the trend.
Practical Guideline:
Only initiate trades during blue bar periods, and only commit/add once your directional bias is confirmed by follow-through in spread direction and EMA slope alignment.
This feature provides a structured framework for disciplined entries, reducing the risk of chasing noise and improving alignment with broader directional bias.
best is to have same indicator twice to see both setting options at same time
Açık kaynak kodlu komut dosyası
Gerçek TradingView ruhuyla, bu komut dosyasının mimarı, yatırımcıların işlevselliğini inceleyip doğrulayabilmesi için onu açık kaynaklı hale getirdi. Yazarı tebrik ederiz! Ücretsiz olarak kullanabilseniz de, kodu yeniden yayınlamanın Topluluk Kurallarımıza tabi olduğunu unutmayın.
Feragatname
Bilgiler ve yayınlar, TradingView tarafından sağlanan veya onaylanan finansal, yatırım, alım satım veya diğer türden tavsiye veya öneriler anlamına gelmez ve teşkil etmez. Kullanım Koşulları bölümünde daha fazlasını okuyun.