OPEN-SOURCE SCRIPT
First EMA Touch (Last N Bars)
Okay, here's a description of the "First EMA Touch (Last N Bars)" TradingView indicator:
Indicator Name: First EMA Touch (Last N Bars)
Core Purpose:
This indicator is designed to visually highlight on the chart the exact moment when the price (specifically, the high/low range of a price bar) makes contact with a specified Exponential Moving Average (EMA) for the first time within a defined recent lookback period (e.g., the last 20 bars).
How it Works:
EMA Calculation: It first calculates a standard Exponential Moving Average (EMA) based on the user-defined EMA Length and EMA Source (e.g., close price). This EMA line is plotted on the chart, often serving as a dynamic level of potential support or resistance.
"Touch" Detection: For every price bar, the indicator checks if the bar's range (from its low to its high) overlaps with or crosses the calculated EMA value for that bar. If low <= EMA <= high, it's considered a "touch".
"First Touch" Logic: This is the key feature. The indicator looks back over a specified number of preceding bars (defined by the Lookback Period). If a "touch" occurs on the current bar, and no "touch" occurred on any of the bars within that preceding lookback window, then the current touch is marked as the "first touch".
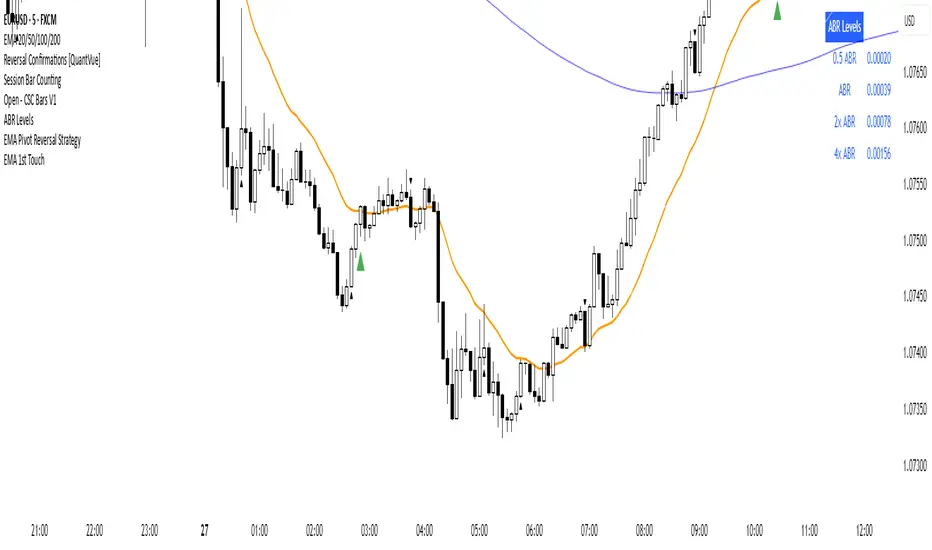
Visual Signal: When a "first touch" condition is met, the indicator plots a distinct shape (by default, a small green triangle) below the corresponding price bar. This makes it easy to spot these specific events.
Key Components & Settings:
EMA Line: The calculated EMA itself is plotted (typically as an orange line) for visual reference.
First Touch Signal: A shape (e.g., green triangle) appears below bars meeting the "first touch" criteria.
EMA Length (Input): Determines the period used for the EMA calculation. Shorter lengths make the EMA more reactive to recent price changes; longer lengths make it smoother and slower.
Lookback Period (Input): Defines how many bars (including the current one) the indicator checks backwards to determine if the current touch is the first one. A lookback of 20 means it checks if there was a touch in the previous 19 bars before signalling the current one as the first.
EMA Source (Input): Specifies which price point (close, open, high, low, hl2, etc.) is used to calculate the EMA.
Interpretation & Potential Uses:
Identifying Re-tests: The signal highlights when price returns to test the EMA after having stayed away from it for the duration of the lookback period. This can be significant as the market re-evaluates the EMA level.
Potential Reversal/Continuation Points: A first touch might indicate:
A potential area where a trend might resume after a pullback (if price bounces off the EMA).
A potential area where a reversal might begin (if price strongly rejects the EMA).
A point of interest if price consolidates around the EMA after the first touch.
Filtering Noise: By focusing only on the first touch within a period, it can help filter out repeated touches that might occur during choppy or consolidating price action around the EMA.
Confluence: Traders might use this signal in conjunction with other forms of analysis (e.g., horizontal support/resistance, trendlines, candlestick patterns, other indicators) to strengthen trade setups.
Limitations:
Lagging: Like all moving averages, the EMA is a lagging indicator.
Not Predictive: The signal indicates a specific past event (the first touch) occurred; it doesn't guarantee a future price movement.
Parameter Dependent: The effectiveness and frequency of signals heavily depend on the chosen EMA Length and Lookback Period. These may need tuning for different assets and timeframes.
Requires Confirmation: It's generally recommended to use this indicator as part of a broader trading strategy and not rely solely on its signals for trade decisions.
In essence, the "First EMA Touch (Last N Bars)" indicator provides a specific, refined signal related to price interaction with a moving average, helping traders focus on potentially significant initial tests of the EMA after a period of separation.
Indicator Name: First EMA Touch (Last N Bars)
Core Purpose:
This indicator is designed to visually highlight on the chart the exact moment when the price (specifically, the high/low range of a price bar) makes contact with a specified Exponential Moving Average (EMA) for the first time within a defined recent lookback period (e.g., the last 20 bars).
How it Works:
EMA Calculation: It first calculates a standard Exponential Moving Average (EMA) based on the user-defined EMA Length and EMA Source (e.g., close price). This EMA line is plotted on the chart, often serving as a dynamic level of potential support or resistance.
"Touch" Detection: For every price bar, the indicator checks if the bar's range (from its low to its high) overlaps with or crosses the calculated EMA value for that bar. If low <= EMA <= high, it's considered a "touch".
"First Touch" Logic: This is the key feature. The indicator looks back over a specified number of preceding bars (defined by the Lookback Period). If a "touch" occurs on the current bar, and no "touch" occurred on any of the bars within that preceding lookback window, then the current touch is marked as the "first touch".
Visual Signal: When a "first touch" condition is met, the indicator plots a distinct shape (by default, a small green triangle) below the corresponding price bar. This makes it easy to spot these specific events.
Key Components & Settings:
EMA Line: The calculated EMA itself is plotted (typically as an orange line) for visual reference.
First Touch Signal: A shape (e.g., green triangle) appears below bars meeting the "first touch" criteria.
EMA Length (Input): Determines the period used for the EMA calculation. Shorter lengths make the EMA more reactive to recent price changes; longer lengths make it smoother and slower.
Lookback Period (Input): Defines how many bars (including the current one) the indicator checks backwards to determine if the current touch is the first one. A lookback of 20 means it checks if there was a touch in the previous 19 bars before signalling the current one as the first.
EMA Source (Input): Specifies which price point (close, open, high, low, hl2, etc.) is used to calculate the EMA.
Interpretation & Potential Uses:
Identifying Re-tests: The signal highlights when price returns to test the EMA after having stayed away from it for the duration of the lookback period. This can be significant as the market re-evaluates the EMA level.
Potential Reversal/Continuation Points: A first touch might indicate:
A potential area where a trend might resume after a pullback (if price bounces off the EMA).
A potential area where a reversal might begin (if price strongly rejects the EMA).
A point of interest if price consolidates around the EMA after the first touch.
Filtering Noise: By focusing only on the first touch within a period, it can help filter out repeated touches that might occur during choppy or consolidating price action around the EMA.
Confluence: Traders might use this signal in conjunction with other forms of analysis (e.g., horizontal support/resistance, trendlines, candlestick patterns, other indicators) to strengthen trade setups.
Limitations:
Lagging: Like all moving averages, the EMA is a lagging indicator.
Not Predictive: The signal indicates a specific past event (the first touch) occurred; it doesn't guarantee a future price movement.
Parameter Dependent: The effectiveness and frequency of signals heavily depend on the chosen EMA Length and Lookback Period. These may need tuning for different assets and timeframes.
Requires Confirmation: It's generally recommended to use this indicator as part of a broader trading strategy and not rely solely on its signals for trade decisions.
In essence, the "First EMA Touch (Last N Bars)" indicator provides a specific, refined signal related to price interaction with a moving average, helping traders focus on potentially significant initial tests of the EMA after a period of separation.
Açık kaynak kodlu komut dosyası
Gerçek TradingView ruhuyla, bu komut dosyasının yaratıcısı, yatırımcıların işlevselliğini inceleyip doğrulayabilmesi için onu açık kaynaklı hale getirdi. Yazarı tebrik ederiz! Ücretsiz olarak kullanabilseniz de, kodu yeniden yayınlamanın Topluluk Kurallarımıza tabi olduğunu unutmayın.
Feragatname
Bilgiler ve yayınlar, TradingView tarafından sağlanan veya onaylanan finansal, yatırım, alım satım veya diğer türden tavsiye veya öneriler anlamına gelmez ve teşkil etmez. Kullanım Koşulları bölümünde daha fazlasını okuyun.