OPEN-SOURCE SCRIPT
India VIX
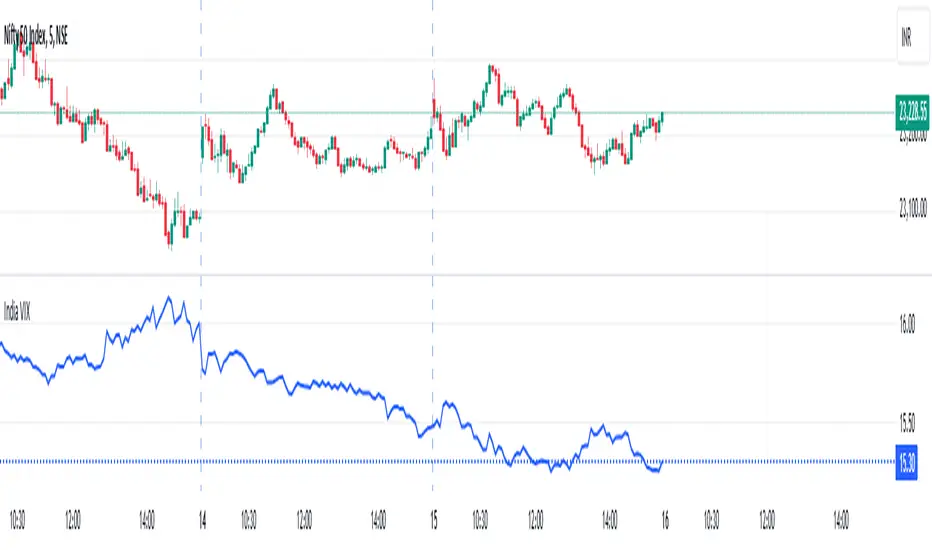
The VIX chart represents the Volatility Index, commonly referred to as the "Fear Gauge" of the stock market. It measures the market's expectations of future volatility over the next 30 days, based on the implied volatility of NSE index options. The VIX is often used as an indicator of investor sentiment, reflecting the level of fear or uncertainty in the market.
Here’s a breakdown of what you might observe on a typical VIX chart:
VIX Value: The y-axis typically represents the VIX index value, with higher values indicating higher levels of expected market volatility (more fear or uncertainty), and lower values signaling calm or stable market conditions.
VIX Spikes: Large spikes in the VIX often correspond to market downturns or periods of heightened uncertainty, such as during financial crises or major geopolitical events. A high VIX is often associated with a drop in the stock market.
VIX Drops: A decline in the VIX indicates a reduction in expected market volatility, usually linked with periods of market calm or rising stock prices.
Trend Analysis: Technical traders might use moving averages or other indicators on the VIX chart to assess the potential for future market movements.
Inverse Relationship with the Stock Market: Typically, there is an inverse correlation between the VIX and the stock market. When stocks fall sharply, volatility increases, and the VIX tends to rise. Conversely, when the stock market rallies or remains stable, the VIX tends to fall.
A typical interpretation would be that when the VIX is low, the market is relatively stable, and when the VIX is high, the market is perceived to be uncertain or volatile.
Açık kaynak kodlu komut dosyası
Gerçek TradingView ruhuyla, bu komut dosyasının yaratıcısı, yatırımcıların işlevselliğini inceleyip doğrulayabilmesi için onu açık kaynaklı hale getirdi. Yazarı tebrik ederiz! Ücretsiz olarak kullanabilseniz de, kodu yeniden yayınlamanın Topluluk Kurallarımıza tabi olduğunu unutmayın.
Feragatname
Bilgiler ve yayınlar, TradingView tarafından sağlanan veya onaylanan finansal, yatırım, alım satım veya diğer türden tavsiye veya öneriler anlamına gelmez ve teşkil etmez. Kullanım Koşulları bölümünde daha fazlasını okuyun.