OPEN-SOURCE SCRIPT
Güncellendi Irrationality Index by CRYPTO_ADA_BTC
"The market can be irrational longer than you can stay solvent" ~ John Maynard Keynes
This indicator, the Irrationality Index, measures how far the current market price has deviated from a smoothed estimate of its "fair value," normalized for recent volatility. It provides traders with a visual sense of when the market may be behaving irrationally, without giving direct buy or sell signals.
How it works:
1. Fair Value Calculation
The indicator estimates a "fair value" for the asset using a combination of a long-term EMA (exponential moving average) and a linear regression trend over a configurable period. This fair value serves as a smoothed baseline for price, balancing trend-following and mean-reversion.
2. Volatility-Adjusted Z-Score
The deviation between price and fair value is measured in standard deviations of recent log returns:
Pine Script®
This standardization accounts for different volatility environments, allowing comparison across assets.
3. Irrationality Score (0–100)
The Z-score is transformed using a logistic mapping into a 0–100 scale:
- 50 → price near fair value (rational zone)
- >75 → high irrationality, price stretched above fair value
- >90 → extreme irrationality, unsustainable extremes
- <25 → high irrationality, price stretched below fair value
- <10 → extreme bearish irrationality
4. Price vs Fair Value (% deviation)
The indicator plots the percentage difference between price and fair value:
Pine Script®
- Positive values → Percentage above fair value (optimistic / overvalued)
- Negative values → Percentage below fair value (pessimistic / undervalued)
Visuals:
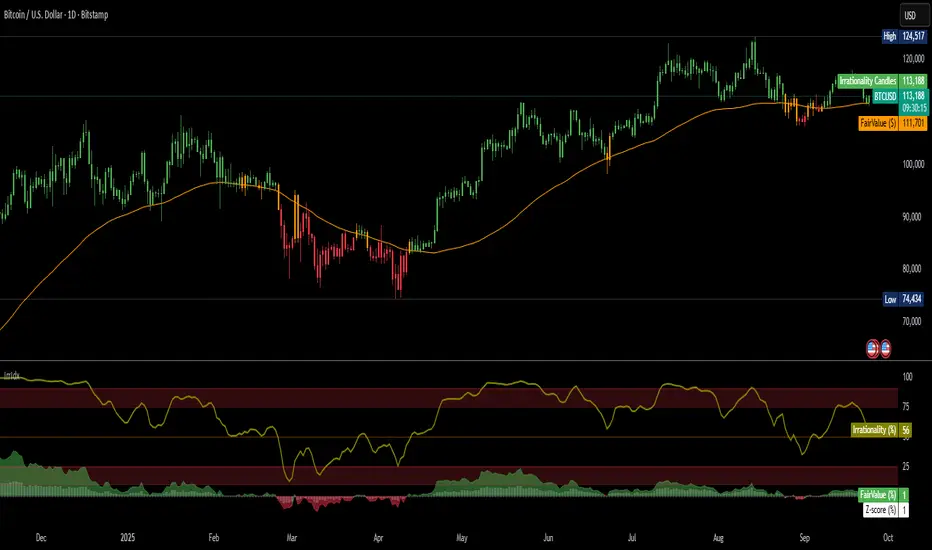
- Irrationality (%) Line (0–100) shows irrationality level.
- Background Colors: Yellow= high bullish irrationality, Green= extreme bullish irrationality, Orange= high bearish irrationality, Red= extreme bearish irrationality.
- Price - FairValue (%) plot: price deviation vs fair value (%), Colored green above 0 and red below 0.
- Label: display actual price, estimated fair value, and Z-score for the latest bar.
- Alerts: configurable thresholds for high and extreme irrationality.
How to read it:
- 50 → Market trading near fair value.
- >75 / >90 → Price may be irrationally high; risk of pullback increases.
- <25 / <10 → Price may be irrationally low; potential rebound zones, but trends can continue.
- Price - FairValue (%) plot → visual guide for % price stretch relative to fair value.
Notes / Warnings:
- Measures relative deviation, not fundamental value!
- High irrationality scores do not automatically indicate trades; markets can remain can be irrational longer than you can stay solvent.
- Best used with other tools: momentum, volume, divergence, and multi-timeframe analysis.
This indicator, the Irrationality Index, measures how far the current market price has deviated from a smoothed estimate of its "fair value," normalized for recent volatility. It provides traders with a visual sense of when the market may be behaving irrationally, without giving direct buy or sell signals.
How it works:
1. Fair Value Calculation
The indicator estimates a "fair value" for the asset using a combination of a long-term EMA (exponential moving average) and a linear regression trend over a configurable period. This fair value serves as a smoothed baseline for price, balancing trend-following and mean-reversion.
2. Volatility-Adjusted Z-Score
The deviation between price and fair value is measured in standard deviations of recent log returns:
Z = (log(price) - log(fairValue)) / volatility
This standardization accounts for different volatility environments, allowing comparison across assets.
3. Irrationality Score (0–100)
The Z-score is transformed using a logistic mapping into a 0–100 scale:
- 50 → price near fair value (rational zone)
- >75 → high irrationality, price stretched above fair value
- >90 → extreme irrationality, unsustainable extremes
- <25 → high irrationality, price stretched below fair value
- <10 → extreme bearish irrationality
4. Price vs Fair Value (% deviation)
The indicator plots the percentage difference between price and fair value:
pctDiff = (price - fairValue) / fairValue * 100
- Positive values → Percentage above fair value (optimistic / overvalued)
- Negative values → Percentage below fair value (pessimistic / undervalued)
Visuals:
- Irrationality (%) Line (0–100) shows irrationality level.
- Background Colors: Yellow= high bullish irrationality, Green= extreme bullish irrationality, Orange= high bearish irrationality, Red= extreme bearish irrationality.
- Price - FairValue (%) plot: price deviation vs fair value (%), Colored green above 0 and red below 0.
- Label: display actual price, estimated fair value, and Z-score for the latest bar.
- Alerts: configurable thresholds for high and extreme irrationality.
How to read it:
- 50 → Market trading near fair value.
- >75 / >90 → Price may be irrationally high; risk of pullback increases.
- <25 / <10 → Price may be irrationally low; potential rebound zones, but trends can continue.
- Price - FairValue (%) plot → visual guide for % price stretch relative to fair value.
Notes / Warnings:
- Measures relative deviation, not fundamental value!
- High irrationality scores do not automatically indicate trades; markets can remain can be irrational longer than you can stay solvent.
- Best used with other tools: momentum, volume, divergence, and multi-timeframe analysis.
Sürüm Notları
"The market can be irrational longer than you can stay solvent" ~ John Maynard KeynesThis indicator, the Irrationality Index, measures how far the current market price has deviated from a smoothed estimate of its "fair value," normalized for recent volatility. It provides traders with a visual sense of when the market may be behaving irrationally, without giving direct buy or sell signals.
How it works:
1. Fair Value Calculation
The indicator estimates a "fair value" for the asset using a combination of a long-term EMA (exponential moving average) and a linear regression trend over a configurable period. This fair value serves as a smoothed baseline for price, balancing trend-following and mean-reversion.
2. Volatility-Adjusted Z-Score
The deviation between price and fair value is measured in standard deviations of recent log returns:
Z = (log(price) - log(fairValue)) / volatility
This standardization accounts for different volatility environments, allowing comparison across assets.
3. Irrationality Score (0–100)
The Z-score is transformed using a logistic mapping into a 0–100 scale:
- 50 → price near fair value (rational zone)
- >75 → high irrationality, price stretched above fair value
- >90 → extreme irrationality, unsustainable extremes
- <25 → high irrationality, price stretched below fair value
- <10 → extreme bearish irrationality
4. Price vs Fair Value (% deviation)
The indicator plots the percentage difference between price and fair value:
pctDiff = (price - fairValue) / fairValue * 100
- Positive values → price above fair value (optimistic / overvalued)
- Negative values → price below fair value (pessimistic / undervalued)
Visuals:
- Irrationality Line (0–100) shows irrationality level.
- Fair Value (%) Plot: price deviation vs fair value (%), colored green above 0 and red below 0.
- Alerts: configurable thresholds for high and extreme irrationality.
How to read it:
- 50 → Market trading near fair value.
- >75 / >90 → Price may be irrationally high; risk of pullback increases.
- <25 / <10 → Price may be irrationally low; potential rebound zones, but trends can continue.
- Fair Value (%) plot → visual guide for % price stretch relative to fair value.
Notes / Warnings:
- Measures relative deviation, not fundamental value.
- High irrationality scores do not automatically indicate trades; markets can remain irrational longer than expected.
- Best used with other tools: momentum, volume, divergence, and multi-timeframe analysis.
Açık kaynak kodlu komut dosyası
Gerçek TradingView ruhuyla, bu komut dosyasının mimarı, yatırımcıların işlevselliğini inceleyip doğrulayabilmesi için onu açık kaynaklı hale getirdi. Yazarı tebrik ederiz! Ücretsiz olarak kullanabilseniz de, kodu yeniden yayınlamanın Topluluk Kurallarımıza tabi olduğunu unutmayın.
Feragatname
Bilgiler ve yayınlar, TradingView tarafından sağlanan veya onaylanan finansal, yatırım, alım satım veya diğer türden tavsiye veya öneriler anlamına gelmez ve teşkil etmez. Kullanım Koşulları bölümünde daha fazlasını okuyun.