ETH MVRV Z Score
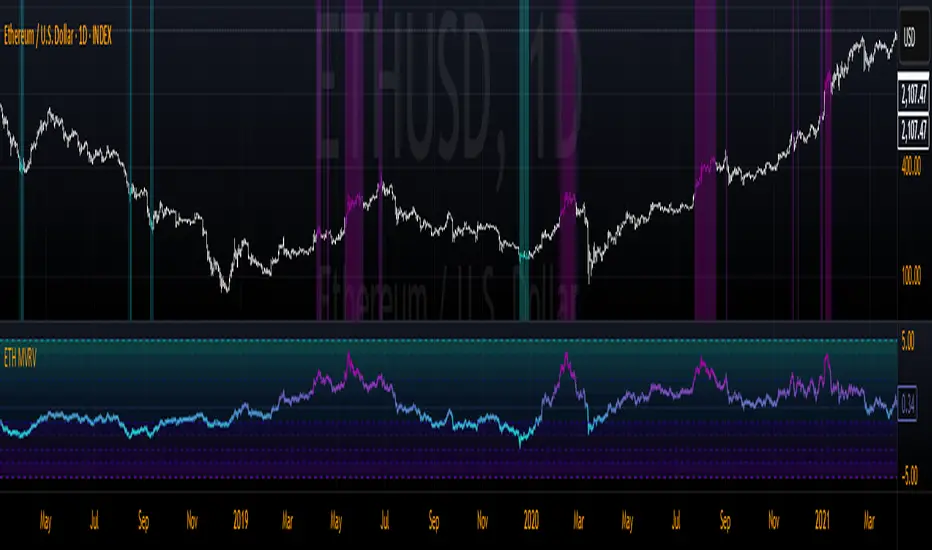
The indicator calculates the Z-score of the MVRV ratio over a user-defined lookback period, visually representing how far the current MVRV deviates from its mean in terms of standard deviations. It features customizable overbought and oversold thresholds, a gradient-based color system for easy interpretation, and optional chart coloring to highlight key market conditions. Horizontal lines and filled zones provide additional context for interpreting the Z-score levels, ranging from extreme undervaluation to extreme overvaluation.
Key Features:
- Z-Score Calculation: Measures the deviation of ETH’s MVRV ratio from its historical average, normalized by standard deviation.
- Customizable Settings: Adjust the lookback length for the Z-score calculation, as well as overbought and oversold thresholds.
- Color Gradient: Visualizes the Z-score with a smooth gradient, transitioning between user-defined colors for oversold, neutral, and overbought states.
- Optional Chart Colors: When enabled, applies dynamic coloring to candlesticks and backgrounds based on the Z-score, enhancing visual analysis.
- Horizontal Levels: Displays predefined Z-score levels (from -5 to 5) with shaded zones to mark significant thresholds.
Inputs:
- Z Length: The lookback period for calculating the Z-score (default: 150).
- Overbought Z Score: The threshold above which ETH is considered overbought (default: 2).
- Oversold Z Score: The threshold below which ETH is considered oversold (default: -2).
- Chart Colors: Toggle to enable/disable dynamic candlestick and background coloring.
- Color Options: Customize colors for oversold, overbought, and neutral zones.
How to Use:
A Z-score above the overbought threshold (e.g., 2) may suggest ETH is overvalued, potentially signaling a selling opportunity.
A Z-score below the oversold threshold (e.g., -2) may indicate undervaluation, potentially signaling a buying opportunity.
The gradient and optional chart colors help quickly identify market conditions, while the horizontal lines provide reference points for extreme deviations.
Best For:
- Long-term investors assessing ETH’s valuation.
- Traders looking for mean-reversion opportunities.
- Analysts combining on-chain metrics with technical analysis.
Yalnızca davetli komut dosyası
Bu komut dosyasına yalnızca yazar tarafından onaylanan kullanıcılar erişebilir. Kullanmak için izin istemeniz ve almanız gerekir. Bu genellikle ödeme yapıldıktan sonra verilir. Daha fazla ayrıntı için aşağıdaki yazarın talimatlarını izleyin veya doğrudan MarktQuant ile iletişime geçin.
Bu özel, yalnızca davetli komut dosyasının komut dosyası moderatörleri tarafından incelenmediğini ve Topluluk Kurallarına uygunluğunun belirlenmediğini unutmayın. TradingView, yazarına tamamen güvenmediğiniz ve nasıl çalıştığını anlamadığınız sürece bir komut dosyası için ödeme yapmanızı veya kullanmanızı TAVSİYE ETMEZ. Ayrıca topluluk komut dosyalarımızda ücretsiz, açık kaynaklı alternatifler bulabilirsiniz.
Yazarın talimatları
📊 whop.com/marktquant
🌐 marktquant.com
Nothing shared on this page constitutes financial advice. All information, tools, and analyses are provided solely for informational and educational purposes.
Feragatname
Yalnızca davetli komut dosyası
Bu komut dosyasına yalnızca yazar tarafından onaylanan kullanıcılar erişebilir. Kullanmak için izin istemeniz ve almanız gerekir. Bu genellikle ödeme yapıldıktan sonra verilir. Daha fazla ayrıntı için aşağıdaki yazarın talimatlarını izleyin veya doğrudan MarktQuant ile iletişime geçin.
Bu özel, yalnızca davetli komut dosyasının komut dosyası moderatörleri tarafından incelenmediğini ve Topluluk Kurallarına uygunluğunun belirlenmediğini unutmayın. TradingView, yazarına tamamen güvenmediğiniz ve nasıl çalıştığını anlamadığınız sürece bir komut dosyası için ödeme yapmanızı veya kullanmanızı TAVSİYE ETMEZ. Ayrıca topluluk komut dosyalarımızda ücretsiz, açık kaynaklı alternatifler bulabilirsiniz.
Yazarın talimatları
📊 whop.com/marktquant
🌐 marktquant.com
Nothing shared on this page constitutes financial advice. All information, tools, and analyses are provided solely for informational and educational purposes.