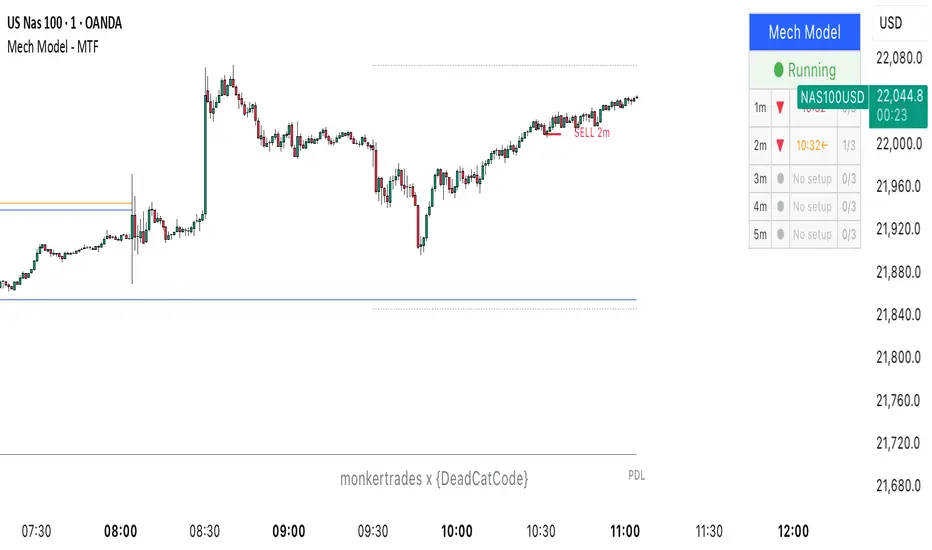
Mech Model - monkertrades x {DeadCatCode}
Detailed Methodology & Underlying Concepts
This indicator automates the Inner Circle Trader (ICT) methodology by identifying institutional order flow through liquidity sweeps and inverse Fair Value Gap (iFVG) formations across multiple timeframes.
Core Logic & Calculations
1. Liquidity Level Identification The script tracks four key liquidity pools:
NY session dynamic LQ detection everytime it sweeps high/low Calculates high/low from 18:00-09:30 EST
Session Extremes: Monitors Asia (20:00-23:00), London (02:00-05:00) session highs/lows
Previous Day Levels: Requests PDH/PDL using request.security() with daily timeframe
Dynamic Updates: Liquidity levels update in real-time when swept during NY session
2. Market Structure Analysis
Uses pivot points logic to understand HH.HL parameters
Classifies pivots as Higher Highs (HH), Higher Lows (HL), Lower Highs (LH), Lower Lows (LL)
Stores last 50 pivots for reference in custom PivotPoint type arrays, background calculations to identfy price legs after sweep
3. Fair Value Gap Detection
Bullish FVG: When low[1] > high[3] (gap between candles)
Bearish FVG: When high[1] < low[3]
Stores FVG data including top, bottom, direction, and bar index
Tracks "wicking" - when price touches but doesn't close through FVG
4. Price Leg Formation (Key Innovation) When liquidity is swept:
Bull Leg: Forms after low sweep, connects previous swing high to sweep point
Bear Leg: Forms after high sweep, connects previous swing low to sweep point
Leg remains "active" and extends with continued liquidity breaks
5. iFVG Signal Generation The signal fires when:
An active price leg exists (post-liquidity sweep)
An FVG within the leg range gets "closed through" (not just wicked)
This creates an inverse FVG (iFVG) - the key entry signal
Signal direction matches leg type (bull leg + bull iFVG = buy signal)
6. Multi-Timeframe Synchronization
Uses request.security() to run detection logic on 1m, 2m, 3m, 4m, 5m
All signals display on 1-minute chart via status table
How Traders Use This
Setup Phase: Script identifies when price sweeps overnight/session liquidity
Confirmation: Waits for FVG within the "price leg" to be violated
Entry Signal: iFVG formation provides precise entry point
Target: Typically the next unmitigated FVG on 5-minute timeframe
Key Parameters Users Can Adjust
Session times for different market hours
Visual elements (colors, transparency, line styles)
Timeframe selection (enable/disable 1m-5m)
Wick grace period (0-100 bars)
Signal display mode (triangles vs horizontal lines)
This script essentially automates the manual process ICT traders use to identify institutional footprints through liquidity raids and subsequent rebalancing via FVG mitigation.
Overview
This indicator automates the Inner Circle Trader (ICT) methodology by identifying institutional order flow through liquidity sweeps and inverse Fair Value Gap (iFVG) formations across multiple timeframes. It tracks price action mechanics to identify high-probability reversal zones where institutional traders are likely positioned.
Detailed Methodology & Underlying Concepts
1. Liquidity Pool Identification & Tracking
The indicator identifies four distinct liquidity pools that institutional traders target:
Overnight Liquidity (Primary)
Continuously tracks high/low from 18:00 EST until NY session start
These levels represent overnight positioning that often gets swept during regular hours
Updates dynamically when swept, creating new reference points
Session-Based Liquidity
Asia Session (20:00-23:00 EST): Tracks range extremes during Asian trading
London Session (02:00-05:00 EST): Monitors European institutional levels
Previous Day High/Low: Retrieved using request.security() with daily timeframe
The logic behind tracking these specific levels: Institutional traders often target areas where retail stop losses accumulate (above highs, below lows).
2. Market Structure Analysis via Pivot Points
Pivot Detection Algorithm:
Uses 3-bar left, 1-bar right pivot identification
Classifies each pivot into market structure categories:
HH (Higher High): Current high > Previous high
HL (Higher Low): Current low > Previous low
LH (Lower High): Current high < Previous high
LL (Lower Low): Current low < Previous low
This classification helps identify:
Trend direction and strength
Key swing points for price leg formation
Potential reversal zones
3. Fair Value Gap (FVG) Detection & Management
FVG Formation Criteria:
Bullish FVG: low[1] > high[3] (upward price gap)
Bearish FVG: high[1] < low[3] (downward price gap)
Advanced FVG Tracking:
Monitors "wicking" - when price touches but doesn't close through the gap
Implements grace period (user-adjustable 0-100 bars) for wick validation
Distinguishes between touched and fully mitigated gaps
Why FVGs Matter: These gaps represent price inefficiencies where orders were absent, creating areas price often returns to "balance".
4. Price Leg Formation - The Core Innovation
This is where the indicator differs from standard ICT implementations:
Leg Creation Process:
Bullish Leg: Forms after a low sweep
Connects previous swing high → liquidity sweep point
Represents potential accumulation after stop hunt
Bearish Leg: Forms after a high sweep
Connects previous swing low → liquidity sweep point
Indicates potential distribution after stop hunt
Dynamic Extension: Legs remain "active" and extend with continued liquidity breaks in the same direction.
5. Signal Generation via Inverse FVG (iFVG)
The Entry Signal Logic:
An active price leg must exist (post-liquidity sweep)
An FVG within the leg's range gets "closed through" (not just wicked)
This creates an inverse FVG - where the original imbalance inverts
Signal fires only when: Leg direction = iFVG direction
Example:
Low swept → Bullish leg active → Bearish FVG closes → Creates Bullish iFVG → BUY signal
6. Multi-Timeframe Analysis & Hierarchy
Timeframe Processing:
Runs detection logic independently on 1m, 2m, 3m, 4m, 5m charts
Uses request.security() for synchronized data retrieval
Hierarchy Rules:
Higher timeframes take precedence (5m > 4m > 3m > 2m > 1m)
When multiple timeframes signal simultaneously, only the highest displays
Hierarchy resets on new liquidity sweeps
Signal Limits:
Each timeframe has configurable daily signal limits (default: 3)
Prevents overtrading by capping signals per timeframe
7. Time-Based Validations
30-Minute Validity Window:
After liquidity sweep, signals must generate within 30 minutes
Prevents stale setups from triggering
Automatically clears expired price legs
Session Restrictions:
Signals only generate during NY session (default: 09:30-16:00)
Aligns with highest liquidity periods
How Traders Use This System
Setup Phase: Wait for liquidity sweep (overnight high/low, session extremes)
Confirmation: Monitor for FVG formation within the resulting price leg
Entry Trigger: Enter when iFVG forms (original FVG gets violated)
Risk Management: Stop typically beyond the liquidity sweep point
Target: Next unmitigated FVG or opposing liquidity level
Key User Parameters
Session Times: Adjust for different market hours/time zones
Visual Settings: Colors, transparency, line styles for all elements
Timeframe Selection: Enable/disable specific timeframes (1m-5m)
Wick Grace Period: Fine-tune FVG validation (0-100 bars)
Signal Limits: Control maximum daily signals per timeframe
Display Options: Table position, theme, label sizes
What Makes This Original
Unlike standard support/resistance or trend indicators, this system:
Tracks institutional liquidity targeting behavior
Identifies order flow imbalances through FVG analysis
Combines both concepts into a mechanical entry system
Provides multi-timeframe confluence with hierarchy rules
Implements time-based validations to ensure setup freshness
This indicator essentially automates what ICT traders manually chart - identifying where institutions trap retail traders through liquidity sweeps, then positioning for reversals when price rebalances through FVG mitigation.
Yalnızca davetli komut dosyası
Bu komut dosyasına yalnızca yazar tarafından onaylanan kullanıcılar erişebilir. Kullanmak için izin istemeniz ve almanız gerekir. Bu izin genellikle ödeme yapıldıktan sonra verilir. Daha fazla ayrıntı için aşağıdaki yazarın talimatlarını izleyin veya doğrudan DeadCatCode ile iletişime geçin.
TradingView, yazarına tam olarak güvenmediğiniz ve nasıl çalıştığını anlamadığınız sürece bir komut dosyası için ödeme yapmanızı veya kullanmanızı ÖNERMEZ. Ayrıca topluluk komut dosyaları bölümümüzde ücretsiz, açık kaynaklı alternatifler bulabilirsiniz.
Yazarın talimatları
Feragatname
Yalnızca davetli komut dosyası
Bu komut dosyasına yalnızca yazar tarafından onaylanan kullanıcılar erişebilir. Kullanmak için izin istemeniz ve almanız gerekir. Bu izin genellikle ödeme yapıldıktan sonra verilir. Daha fazla ayrıntı için aşağıdaki yazarın talimatlarını izleyin veya doğrudan DeadCatCode ile iletişime geçin.
TradingView, yazarına tam olarak güvenmediğiniz ve nasıl çalıştığını anlamadığınız sürece bir komut dosyası için ödeme yapmanızı veya kullanmanızı ÖNERMEZ. Ayrıca topluluk komut dosyaları bölümümüzde ücretsiz, açık kaynaklı alternatifler bulabilirsiniz.