OPEN-SOURCE SCRIPT
Güncellendi INDIA/NIFTY DOWN DAY MARKER

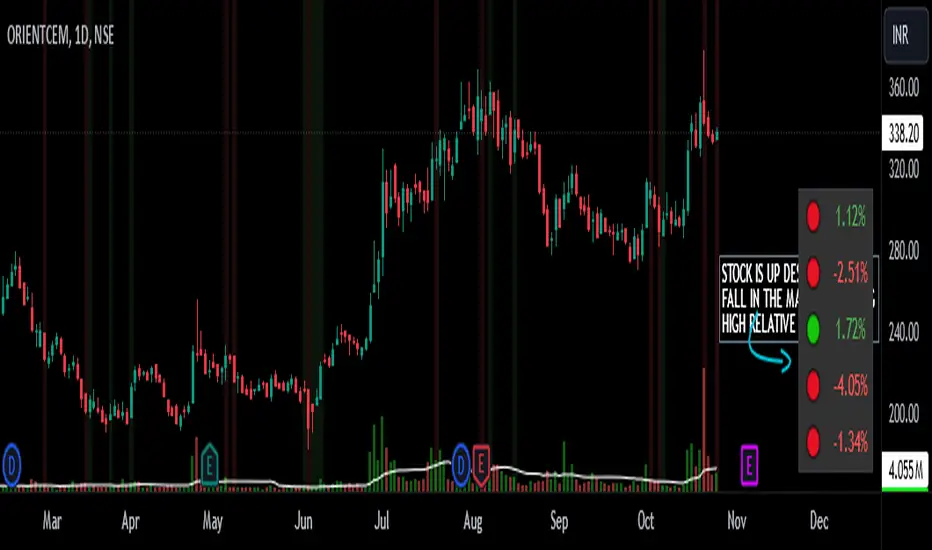
INDIA/NIFTY DOWN DAY MARKER is indicator designed for Indian investors that provides visual cues on whole universe of stock charts marking volatile days based on the performance of selected Indian market indices. This indicator helps traders and investors assess the relative strength of individual stocks during extreme market movements
Key Features:
1) Index Selection: Users can choose from four major Indian indices: Nifty 50, Nifty Midcap 100, Nifty Smallcap 100, and Nifty MIDSMALLCAP 400. This flexibility allows for tailored analysis based on market focus.
2) Customizable Thresholds: Users can set their desired percentage thresholds for both rise and fall days, with default values of 2%. This customization enables users to adapt the indicator to their trading strategies.
3) Visual Indicators:
Rise Days: When the selected index rises by the specified percentage, the chart background turns green, indicating a bullish trend.
Fall Days: Conversely, if the index falls by the defined percentage, the background changes to red, signaling a bearish trend.
Sürüm Notları
This script basically allows you to mark the days on all charts when markets are extremely volatile. The aim is to check the relative strength of a stock on days when markets are in panic.
If a stock is rising while the whole market has fallen, this shows higher strength and potential for a big upmove in the upcoming days. This ensures you trade only strongest stocks.
Example: You can mark the day when Nifty falls or rises by, let’s say, 1.5%. This allows you to check the behavior of the stock on that day.
Also, a table has been added, showing the percentage change of the stock on marked days. This allows you to easily check the stock's performance.
Features:
- Can mark both up and down days on the desired index.
- Customize value on index fall or rise.
- Option to mark up days in the index (by default turned off).
- Enable dates on tables if desired.
- Supports both dark mode and normal mode.
- Select the number of days to be displayed on the table.
The green symbol in the first column of the table shows that the index rose by the specified percentage on that day, whereas the red symbolizes fall days.
The last column shows the performance of the particular stock on that day.
Tip: Disable coloring on the charts if it is distracting; you can use the table only. To do this, simply go to settings, then style, and uncheck the background color boxes.
Açık kaynak kodlu komut dosyası
Gerçek TradingView ruhuna uygun olarak, bu komut dosyasının oluşturucusu bunu açık kaynaklı hale getirmiştir, böylece yatırımcılar betiğin işlevselliğini inceleyip doğrulayabilir. Yazara saygı! Ücretsiz olarak kullanabilirsiniz, ancak kodu yeniden yayınlamanın Site Kurallarımıza tabi olduğunu unutmayın.
Feragatname
Bilgiler ve yayınlar, TradingView tarafından sağlanan veya onaylanan finansal, yatırım, işlem veya diğer türden tavsiye veya tavsiyeler anlamına gelmez ve teşkil etmez. Kullanım Şartları'nda daha fazlasını okuyun.