PROTECTED SOURCE SCRIPT
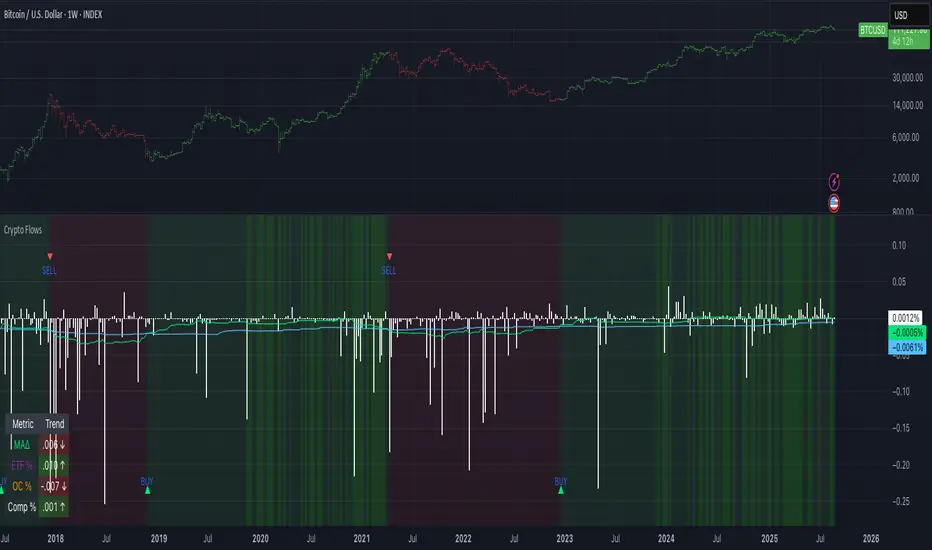
Crypto Flows [ETF|On-chain]
The surge in Bitcoin and Ethereum spot ETFs has transformed how crypto is held and traded. By mid‑2025, U.S. spot Bitcoin ETFs already controlled roughly 1.28 million BTC, or about 6.5 percent of the circulating supply (Fosque, 2025). This accumulation has coincided with sharp price rallies and signals that regulated vehicles are absorbing a meaningful share of supply (Fosque, 2025; Wright, 2025). At the same time, on‑chain analytics show that exchange flows still influence markets: large inflows to exchanges often precede sell‑offs, whereas withdrawals to private wallets signal accumulation and reduced sell pressure (Singh, 2024; CryptoQuant, 2024). IntoTheBlock’s large‑holder inflow indicator even notes that spikes in whale buying frequently mark major bottoms (IntoTheBlock, 2022). I wanted to weave these pieces together, so I created this indicator.
Essence and logic
The script draws from two data streams: net flows into ETFs and net on‑chain flows from large holders, both scaled by the asset’s circulating market cap. ETF flows are aggregated across the ten largest BTCUSD Bitcoin ETFs, the ten largest Ethereum
  ETHUSD ETFs and the first
  SOL Solana ETF; each fund has its own checkbox and colour selection. On‑chain data uses IntoTheBlock’s large‑holder inflows and outflows, with dozens of coins available(
  XRPUSD
  AVAX
AVAX  ADA
ADA  LINK
LINK  DOGEUSD
  OTHERS ; if your coin isn’t shown in the dropdown you can manually enter its symbol. For each component, daily flows are converted into either a Z‑score or, by default, a percent‑of‑market‑cap series; users choose the weighting between ETF and on‑chain signals. These weighted series are summed into a composite, smoothed, and then two moving averages (a fast and a slow one) are applied to define bullish or bearish regimes. Because ETFs are a recent phenomenon, the early part of the composite is dominated by on‑chain flows; as ETF history lengthens, the fund‑flow component will become more influential. Trade signals are generated via moving‑average crossovers and optional dip triggers, and a trend table summarises current values and directions.
Why these components?
ETF flows reflect institutional adoption and supply absorption. Funds such as IBIT already hold about 744 000 BTC (roughly 3.3 percent of total supply), and cumulative ETF holdings have been growing faster than new coins are mined (Wright, 2025). Net inflows into these vehicles have tended to accompany rising prices and signal long‑horizon capital (Fosque, 2025). On‑chain flows, meanwhile, capture exchange liquidity dynamics. High inflows to exchanges often indicate that investors are preparing to sell, increasing tradable supply (Singh, 2024; CryptoQuant, 2024). Outflows into self‑custody suggest accumulation and reduced sell pressure, providing a bullish signal (Singh, 2024; CryptoQuant, 2024). IntoTheBlock points out that spikes in large‑holder inflows—whales moving coins into cold storage—have historically preceded price bottoms (IntoTheBlock, 2022). By weighting and standardising these flows relative to market cap, the composite aims to offer a more objective lens on risk‑on versus risk‑off regimes than price alone.
Limitations and outlook
ETFs a pretty new, so the data history is short. The list of tracked funds is currently limited to U.S. and European products; adding Asian or Canadian vehicles could provide a fuller picture. On‑chain flows can be noisy and occasionally give conflicting signals, and large‑holder data is not available for every crypto asset. The ETF and on‑chain components are also correlated through market cap, so equal weighting may amplify common trends. As macro conditions evolve and ETF redemption mechanisms change, the usefulness of fund flows could vary. I see this indicator as one tool among many, and I’m considering adding stablecoin flows, derivatives funding rates, or halving‑cycle adjustments. Suggestions are welcome.
Personal note
I’m a student who enjoys exploring the intersection of macro flows, on‑chain analytics and market psychology. This script is free to use. You can enable or disable each component, adjust weights, change the display mode and lookback, and select individual ETF tickers. If it brings you value, feel free to follow my work or reach out with feedback. I appreciate your support. Please remember that this indicator is for educational purposes and not investment advice. I built this indicator in addition to my Liquidity indicator, where I use Global M2, the yield curve, and the high-yield spread to define risk-on/risk-off regimes. If you are interested, you can find it here:
![BTC Regime Phase [HY|YC|GLI]](https://s3.tradingview.com/s/sYvx3fwR_mid.png)
References
CryptoQuant Team. (2024). Exchange in/outflow and netflow user guide.
Fosque, J. (2025). Bitcoin ETFs pull $17.8 billion in 90 days as price surges past $118 K. The Digital Chamber.
IntoTheBlock. (2022). Large holders inflow indicator description.
Singh, O. (2024). Crypto exchange inflows and outflows explained: What they reveal about market trends. CCN.
Wright, L. (2025). Bitcoin ETFs to lock up 1.5 million BTC by New Year as supply squeeze tightens grip. CryptoSlate.
Essence and logic
The script draws from two data streams: net flows into ETFs and net on‑chain flows from large holders, both scaled by the asset’s circulating market cap. ETF flows are aggregated across the ten largest
Why these components?
ETF flows reflect institutional adoption and supply absorption. Funds such as IBIT already hold about 744 000 BTC (roughly 3.3 percent of total supply), and cumulative ETF holdings have been growing faster than new coins are mined (Wright, 2025). Net inflows into these vehicles have tended to accompany rising prices and signal long‑horizon capital (Fosque, 2025). On‑chain flows, meanwhile, capture exchange liquidity dynamics. High inflows to exchanges often indicate that investors are preparing to sell, increasing tradable supply (Singh, 2024; CryptoQuant, 2024). Outflows into self‑custody suggest accumulation and reduced sell pressure, providing a bullish signal (Singh, 2024; CryptoQuant, 2024). IntoTheBlock points out that spikes in large‑holder inflows—whales moving coins into cold storage—have historically preceded price bottoms (IntoTheBlock, 2022). By weighting and standardising these flows relative to market cap, the composite aims to offer a more objective lens on risk‑on versus risk‑off regimes than price alone.
Limitations and outlook
ETFs a pretty new, so the data history is short. The list of tracked funds is currently limited to U.S. and European products; adding Asian or Canadian vehicles could provide a fuller picture. On‑chain flows can be noisy and occasionally give conflicting signals, and large‑holder data is not available for every crypto asset. The ETF and on‑chain components are also correlated through market cap, so equal weighting may amplify common trends. As macro conditions evolve and ETF redemption mechanisms change, the usefulness of fund flows could vary. I see this indicator as one tool among many, and I’m considering adding stablecoin flows, derivatives funding rates, or halving‑cycle adjustments. Suggestions are welcome.
Personal note
I’m a student who enjoys exploring the intersection of macro flows, on‑chain analytics and market psychology. This script is free to use. You can enable or disable each component, adjust weights, change the display mode and lookback, and select individual ETF tickers. If it brings you value, feel free to follow my work or reach out with feedback. I appreciate your support. Please remember that this indicator is for educational purposes and not investment advice. I built this indicator in addition to my Liquidity indicator, where I use Global M2, the yield curve, and the high-yield spread to define risk-on/risk-off regimes. If you are interested, you can find it here:
References
CryptoQuant Team. (2024). Exchange in/outflow and netflow user guide.
Fosque, J. (2025). Bitcoin ETFs pull $17.8 billion in 90 days as price surges past $118 K. The Digital Chamber.
IntoTheBlock. (2022). Large holders inflow indicator description.
Singh, O. (2024). Crypto exchange inflows and outflows explained: What they reveal about market trends. CCN.
Wright, L. (2025). Bitcoin ETFs to lock up 1.5 million BTC by New Year as supply squeeze tightens grip. CryptoSlate.
Korumalı komut dosyası
Bu komut dosyası kapalı kaynak olarak yayınlanmaktadır. Ancak, ücretsiz ve herhangi bir sınırlama olmaksızın kullanabilirsiniz – daha fazla bilgiyi buradan edinebilirsiniz.
Feragatname
Bilgiler ve yayınlar, TradingView tarafından sağlanan veya onaylanan finansal, yatırım, alım satım veya diğer türden tavsiye veya öneriler anlamına gelmez ve teşkil etmez. Kullanım Koşulları bölümünde daha fazlasını okuyun.