INVITE-ONLY SCRIPT
Ethereum: Price Action Integral Bands
Güncellendi
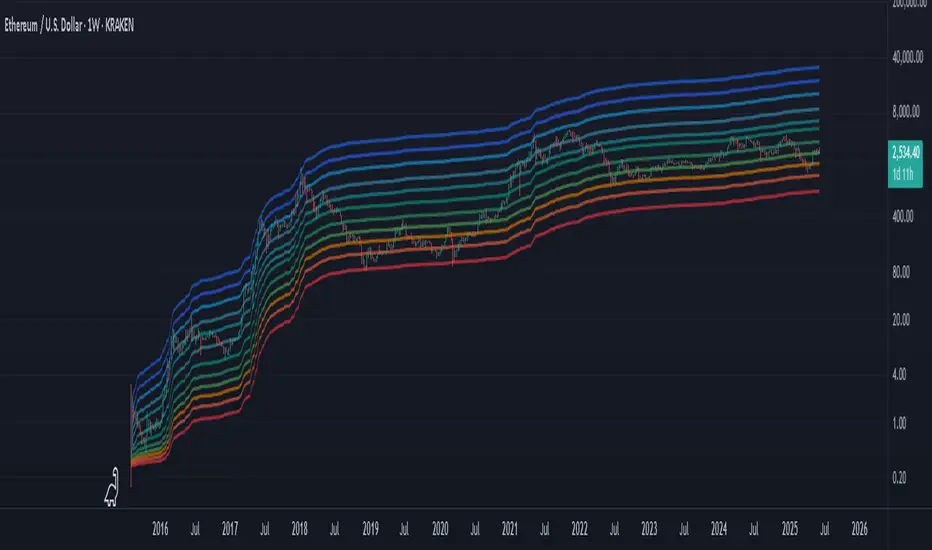
This indicator tries to display absolute tops and bottoms for Ethereum. The price action gets integrated with three custom functions resulting in the blue top, green mid and red bottom price action integrals. From those integral values we allow 5% deviation in up and down direction, leading to price action integral bands of some non-zero width.
Even during the liquidity crisis in March 2020 with abnormal price movements, Ethereum had no daily or weekly candle close below the support band. For longer-term trades it might be a good idea to buy ETH when price is around the red band, and temporarily sell/go short when ETH is around the blue band, although this is no financial advice and one should always cross-check with other indicators/informations.
The green mid price action integral band indicates bullish/bearish zones. When price is located above the green band, the market is in a bullish environment, if price lies below it, the market is in a bearish environment.
There's the option to plot or hide the bands individually.
These integral bands are specifically designed for the Ethereum (ETHUSD) Kraken ticker on daily (D) or weekly (W) timeframe (the indicator automatically adjusts for both those timeframes). For other assets, tickers and timeframes the functionality of this indicator cannot be guaranteed and will most probably not deliver meaningful results. If you want to use the integral bands for Bitcoin, please see my other indicator titled 'Bitcoin: Price Action Integral Bands'.
For access please contact me via DM on TradingView or on Twitter (linked in my TradingView profile and my signature).
Sürüm Notları
Updated the mid integral band. Also after review I would recommend to use the daily (D) timeframe for this indicator, as it seems to be more accurate there (better integrating due to finer price action data I assume).Sürüm Notları
Tweaked the top integral band to better fit to the general market data (as the 2018 ATH price of the Kraken ETH/USD pair was an outlier compared to other order books).Sürüm Notları
Added two more integral bands for finer trading opportunities: a turquoise top-mid band, and an orange bottom-mid band.Sürüm Notları
Added a full array of bands for many additional trading opportunities, and especially for a mapping of the parabolic fallout following a bullrun. The idea would be to trade the next parabolic fallout roughly as depicted in the chart below (marked are the relative increases/decreases of each broader move during the fallout):Depending on how this indicator is used, the set up of stop losses is recommended in case no reversal happens at certain bands.
Sürüm Notları
Small readjustment update of the 4th band.Yalnızca davetli komut dosyası
Bu komut dosyasına erişim, yazar tarafından yetkilendirilen kullanıcılarla sınırlıdır ve genellikle ödeme gerektirir. Sık kullanılanlarınıza ekleyebilirsiniz, ancak bunu yalnızca izin talep edip yazarından bu izni aldıktan sonra kullanabileceksiniz. Daha fazla bilgi için Dean_Trader ile iletişime geçin veya yazarın aşağıdaki talimatlarını izleyin.
TradingView, yazarına %100 güvenmediğiniz ve komut dosyasının nasıl çalıştığını anlamadığınız sürece bir komut dosyası için ödeme yapmanızı ve onu kullanmanızı önermez. Çoğu durumda, Topluluk Komut Dosyaları bölümümüzde ücretsiz olarak iyi bir açık kaynak alternatifi bulabilirsiniz.
Yazarın talimatları
″For access please contact me via DM on TradingView or on Twitter (linked in my TradingView profile and my signature).
Bu komut dosyasını bir grafikte kullanmak ister misiniz?
Uyarı: Erişim talebinde bulunmadan önce lütfen okuyun.
Website (for access to my scripts): deantrader.com
Twitter (for Swing Algo footage): twitter.com/Dean_Trader
Twitter (for Swing Algo footage): twitter.com/Dean_Trader
Feragatname
Bilgiler ve yayınlar, TradingView tarafından sağlanan veya onaylanan finansal, yatırım, işlem veya diğer türden tavsiye veya tavsiyeler anlamına gelmez ve teşkil etmez. Kullanım Şartları'nda daha fazlasını okuyun.