BG 3:00 / 2:00 Candle High/Low LinesBG 3:00 Candle High/Low Lines
This indicator highlights the high and low of the 1-hour candle exactly at 3:00 AM Bulgarian local time (EET/EEST). Horizontal lines are drawn at these levels and extended 5 hours forward, providing clear visualization of key daily levels.
Key Features:
Automatically adjusts for Bulgarian local time, including daylight saving time changes.
Marks only the 3:00 AM candle on the 1-hour chart for a clean and focused view.
Allows customizable colors for the high and low lines separately.
Lines extend 5 hours ahead to aid in tracking important support and resistance levels.
Ideal for traders analyzing the Bulgarian market or anyone interested in monitoring the 3:00 AM Europe/Sofia time frame.
Use this tool to identify crucial price levels aligned with Bulgarian time and enhance your intraday trading strategy.
Ethereum (Kriptopara)

Ethereum Rainbow Chart (9 Levels with Legend)The Ethereum Rainbow Chart is a long-term, color-coded chart that displays Ethereum’s price on a logarithmic scale to show historical trends and growth patterns. It uses colored bands to highlight different price zones, helping to visualize how ETH’s price has moved over time without focusing on short-term fluctuations.

Ultimate Stochastics Strategy by NHBprod Use to Day Trade BTCHey All!
Here's a new script I worked on that's super simple but at the same time useful. Check out the backtest results. The backtest results include slippage and fees/commission, and is still quite profitable. Obviously the profitability magnitude depends on how much capital you begin with, and how much the user utilizes per order, but in any event it seems to be profitable according to backtests.
This is different because it allows you full functionality over the stochastics calculations which is designed for random datasets. This script allows you to:
Designate ANY period of time to analyze and study
Choose between Long trading, short trading, and Long & Short trading
It allows you to enter trades based on the stochastics calculations
It allows you to EXIT trades using the stochastics calculations or take profit, or stop loss, Or any combination of those, which is nice because then the user can see how one variable effects the overall performance.
As for the actual stochastics formula, you get control, and get to SEE the plot lines for slow K, slow D, and fast K, which is usually not considered.
You also get the chance to modify the smoothing method, which has not been done with regular stochastics indicators. You get to choose the standard simple moving average (SMA) method, but I also allow you to choose other MA's such as the HMA and WMA.
Lastly, the user gets the option of using a custom trade extender, which essentially allows a buy or sell signal to exist for X amount of candles after the initial signal. For example, you can use "max bars since signal" to 1, and this will allow the indicator to produce an extra sequential buy signal when a buy signal is generated. This can be useful because it is possible that you use a small take profit (TP) and quickly exit a profitable trade. With the max bars since signal variable, you're able to reenter on the next candle and allow for another opportunity.
Let me know if you have any questions! Please take a look at the performance report and let me know your thoughts! :)

Currency ComparatorIndicator Description
This script helps you compare the price changes of various cryptocurrencies against each other.
While TradingView provides some pairs like ETH/BTC or BNB/BTC, it lacks support for comparing lower-market-cap coins against BTC or other currencies. That’s where this script comes in, allowing you to easily view ratios like DOGS/BTC, LSD/BTC, and more.
You can also analyze the relationship between two high-market-cap assets, such as ETH/SOL, which is often not available directly on TradingView.
Additionally, this indicator enables you to view the changes of two cryptocurrencies alongside a base currency. For example, you can observe how Bitcoin's rise impacts LSD and whether it strengthens or weakens relative to BTC.
Features
Maximized View: You can open the indicator in a maximized chart view and use it like any other chart for your technical analysis.
Customizable Comparisons: Compare any two assets with ease by configuring the indicator inputs.
Important Notes
1.Preserving Drawings:
Drawings and tools applied to the indicator chart are not tied to the indicator’s settings. This means changing the inputs won’t affect them. To avoid losing your work:
Open the chart of the base asset (e.g., LSD/USDT) where you want to analyze a specific pair (e.g., LSD/BTC).
Use the indicator there. This way, whenever you want to revisit your analysis, you only need to open the base chart (e.g., LSD/USDT) and update the indicator inputs to the desired pair (e.g., LSD/BTC).
2.Deleting the Indicator:
Removing the indicator from the chart will also delete all your drawings. If you need to keep them, do not delete the indicator.
3.Precision Settings:
By default, the indicator displays up to 12 decimal places (precision). For pairs where such precision isn’t required, you can adjust it in the settings under the "Style" section to your preferred value. If you need higher precision again, simply reset it to the default value.

Cabal Dev IndicatorThis is a TradingView Pine Script (version 6) that creates a technical analysis indicator called the "Cabal Dev Indicator." Here's what it does:
1. Core Functionality:
- It calculates a modified version of the Stochastic Momentum Index (SMI), which is a momentum indicator that shows where the current close is relative to the high/low range over a period
- The indicator combines elements of stochastic oscillator calculations with exponential moving averages (EMA)
2. Key Components:
- Uses configurable input parameters for:
- Percent K Length (default 15)
- Percent D Length (default 3)
- EMA Signal Length (default 15)
- Smoothing Period (default 5)
- Overbought level (default 40)
- Oversold level (default -40)
3. Calculation Method:
- Calculates the highest high and lowest low over the specified period
- Finds the difference between current close and the midpoint of the high-low range
- Applies EMA smoothing to both the range and relative differences
- Generates an SMI value and further smooths it using a simple moving average (SMA)
- Creates an EMA signal line based on the smoothed SMI
4. Visual Output:
- Plots the smoothed SMI line in green
- Plots an EMA signal line in red
- Shows overbought and oversold levels as gray horizontal lines
- Fills the areas above the overbought level with light red
- Fills the areas below the oversold level with light green
This indicator appears designed to help traders identify potential overbought and oversold conditions in the market, as well as momentum shifts, which could be used for trading decisions.
Would you like me to explain any specific part of the indicator in more detail?

Crypto Wallets Profitability & Performance [LuxAlgo]The Crypto Wallets Profitability & Performance indicator provides a comprehensive view of the financial status of cryptocurrency wallets by leveraging on-chain data from IntoTheBlock. It measures the percentage of wallets profiting, losing, or breaking even based on current market prices.
Additionally, it offers performance metrics across different timeframes, enabling traders to better assess market conditions.
This information can be crucial for understanding market sentiment and making informed trading decisions.
🔶 USAGE
🔹 Wallets Profitability
This indicator is designed to help traders and analysts evaluate the profitability of cryptocurrency wallets in real-time. It aggregates data gathered from the blockchain on the number of wallets that are in profit, loss, or breaking even and presents it visually on the chart.
Breaking even line demonstrates how realized gains and losses have changed, while the profit and the loss monitor unrealized gains and losses.
The signal line helps traders by providing a smoothed average and highlighting areas relative to profiting and losing levels. This makes it easier to identify and confirm trading momentum, assess strength, and filter out market noise.
🔹 Profitability Meter
The Profitability Meter is an alternative display that visually represents the percentage of wallets that are profiting, losing, or breaking even.
🔹 Performance
The script provides a view of the financial health of cryptocurrency wallets, showing the percentage of wallets in profit, loss, or breaking even. By combining these metrics with performance data across various timeframes, traders can gain valuable insights into overall wallet performance, assess trend strength, and identify potential market reversals.
🔹 Dashboard
The dashboard presents a consolidated view of key statistics. It allows traders to quickly assess the overall financial health of wallets, monitor trend strength, and gauge market conditions.
🔶 DETAILS
🔹 The Chart Occupation Option
The chart occupation option adjusts the occupation percentage of the chart to balance the visibility of the indicator.
🔹 The Height in Performance Options
Crypto markets often experience significant volatility, leading to rapid and substantial gains or losses. Hence, plotting performance graphs on top of the chart alongside other indicators can result in a cluttered display. The height option allows you to adjust the plotting for balanced visibility, ensuring a clearer and more organized chart.
🔶 SETTINGS
The script offers a range of customizable settings to tailor the analysis to your trading needs.
Chart Occupation %: Adjust the occupation percentage of the chart to balance the visibility of the indicator.
🔹 Profiting Wallets
Profiting Percentage: Toggle to display the percentage of wallets in profit.
Smoothing: Adjust the smoothing period for the profiting percentage line.
Signal Line: Choose a signal line type (SMA, EMA, RMA, or None) to overlay on the profiting percentage.
🔹 Losing Wallets
Losing Percentage: Toggle to display the percentage of wallets in loss.
Smoothing: Adjust the smoothing period for the losing percentage line.
Signal Line: Choose a signal line type (SMA, EMA, RMA, or None) to overlay on the losing percentage.
🔹 Breaking Even Wallets
Breaking-Even Percentage: Toggle to display the percentage of wallets breaking even.
Smoothing: Adjust the smoothing period for the breaking-even percentage line.
🔹 Profitability Meter
Profitability Meter: Enable or disable the meter display, set its width, and adjust the offset.
🔹 Performance
Performance Metrics: Choose the timeframe for performance metrics (Day to Date, Week to Date, etc.).
Height: Adjust the height of the chart visuals to balance the visibility of the indicator.
🔹 Dashboard
Block Profitability Stats: Toggle the display of profitability stats.
Performance Stats: Toggle the display of performance stats.
Dashboard Size and Position: Customize the size and position of the performance dashboard on the chart.
🔶 RELATED SCRIPTS
Market-Sentiment-Technicals
Multi-Chart-Widget

Altcoin Total Average Divergence (YavuzAkbay)The "Average Price and Divergence" indicator is a strong tool built exclusively for cryptocurrency traders who understand the significance of comparing altcoins to Bitcoin (BTC). While traditional research frequently focusses on the value of cryptocurrencies against fiat currencies such as the US dollar, this indicator switches the focus to the value of altcoins against Bitcoin itself, allowing you to detect potential market opportunities and divergences.
The indicator allows you to compare the price of an altcoin to Bitcoin (e.g., ETHBTC, SOLBTC), which is critical for determining how well an altcoin performs against the main cryptocurrency. This is especially important for investors who expect Bitcoin's price will continue to rise logarithmically and want to ensure that their altcoin holdings retain or expand in market capitalisation compared to Bitcoin.
The indicator computes the average price of the chosen cryptocurrency relative to Bitcoin over the viewable portion of the chart. This average acts as a benchmark, indicating the normal value around which the altcoin's price moves.
The primary objective of this indicator is to calculate and plot the divergence, which is the difference between the altcoin's current price relative to Bitcoin and its average value. This divergence can reveal probable overbought or oversold conditions, allowing traders to make better decisions about entry and exit points.
The divergence is represented as a histogram, with bars representing the magnitude of the difference between the current and average prices. Positive values indicate that the altcoin is trading above its average value in comparison to Bitcoin, whereas negative values indicate that it is trading below its average.
The indicator automatically adjusts to the chart's visible range, ensuring that the average price and divergence are always calculated using the most relevant data. This makes the indicator extremely sensitive to changes in the chart view and market conditions.
How to Use:
A significant positive divergence may imply that the cryptocurrency is overbought in comparison to Bitcoin and is headed for a correction. A significant negative divergence, on the other hand, may indicate that the cryptocurrency has been oversold and is cheap in comparison to Bitcoin.
Tracking how an altcoin's price deviates from its average relative to Bitcoin can provide insights about the market's opinion towards that altcoin. Persistent positive divergence may suggest high market confidence, whilst constant negative divergence may imply a lack of interest or eroding fundamentals.
Use divergence data to better time your trades, either by entering when a cryptocurrency is discounted in comparison to its average (negative divergence) or departing when it is overpriced (positive divergence). This allows you to capture value as the price returns to its mean.
Ideal For:
Cryptocurrency Traders who want to understand how altcoins are performing relative to Bitcoin rather than just against fiat currencies.
Long-term Investors looking to ensure their altcoin investments are maintaining or growing their value relative to Bitcoin.
Market Analysts interested in identifying potential reversals or continuations in altcoin prices based on divergence from their average value relative to Bitcoin.

Quatro SMA Strategy [4h]Hello, I would like to present to you The "Quatro SMA" strategy
Strategy is based on four simple moving averages of different lengths and monitoring trading volume. The key idea is to identify strong market trends by comparing short-term moving averages with the long-term SMA. The strategy generates buy signals when all short-term SMAs are above the SMA(200) and the volume confirms the strength of the move. Similarly, sell signals are generated when all short-term SMAs are below the SMA(200), and the volume is sufficiently high.
The strategy manages risk by applying a stop loss and three different Take Profit levels (TP1, TP2, TP3), with varying percentages of the position closed at each level.
Each Take Profit level is triggered at a specific percentage gain, with the position being closed gradually depending on the achieved targets. The percentage of the position closed at each TP level is also defined by the user.
Indicators and Parameters:
Simple Moving Averages (SMA):
The script utilizes four simple moving averages with different lengths (4, 16, 32, 200). The first three SMAs (SMA1, SMA2, SMA3) are used to determine the trend direction, while the fourth SMA (with a length of 200) serves as a support/resistance line.
Volume:
The script monitors trading volume and checks if the current volume exceeds 2.5 times the average volume of the last 40 candles. High volume is considered as confirmation of trend strength.
Entry Conditions:
- Long Position: Triggered when SMA1 > SMA2 > SMA3, the closing price is above SMA(200), and the volume condition is met.
- Short Position: Triggered when SMA1 < SMA2 < SMA3, the closing price is below SMA(200), and the volume condition is met.
Exit Conditions:
- Long Position: Closed when SMA1 < SMA2 < SMA3 and the closing price is above SMA(200).
- Short Position: Closed when SMA1 > SMA2 > SMA3 and the closing price is below SMA(200).
to determine the level of stop loss and target point I used a piece of code by RafaelZioni, here is the script from which a piece of code was taken
I hope the strategy will be helpful, as always, best regards and safe trades
;)

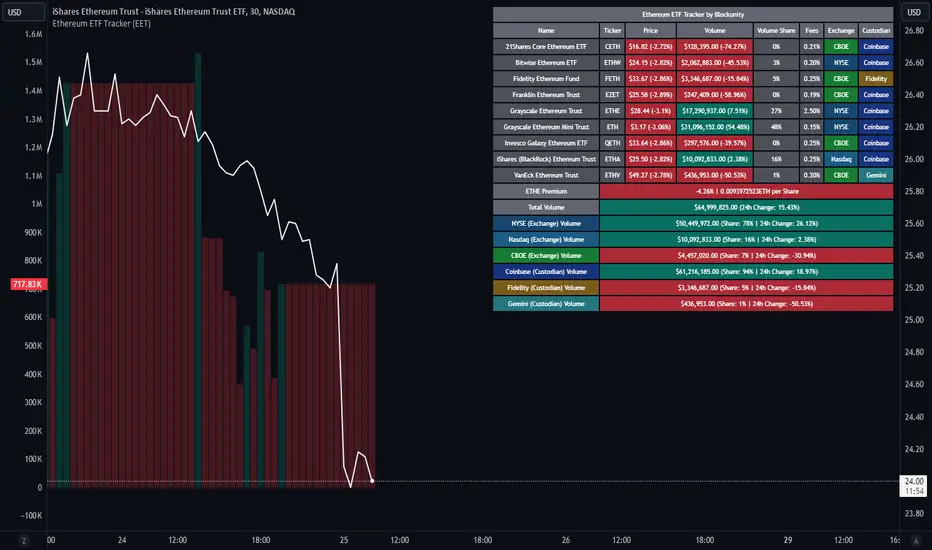
Ethereum ETF Tracker (EET)Get all the information you need about all the different Ethereum ETF.
With the Ethereum ETF Tracker, you can observe all possible Ethereum ETF data:
ETF name.
Ticker.
Price.
Volume.
Share of total ETF volume.
Fees.
Exchange.
Custodian.
At the bottom of the table, you'll find the ETHE Premium (and ETH per Share), and day's total volume.
In addition, you can see the volume for the different Exchanges, as well as for the different Custodians.
If you don't want to display these lines to save space, you can uncheck "Show Additional Data" in the indicator settings.
The Idea
The goal is to provide the community with a tool for tracking all Ethereum ETF data in a synthesized way, directly in your TradingView chart.
How to Use
Simply read the information in the table. You can hover above the Fees and Exchanges cells for more details.
The table takes space on the chart, you can remove the extra lines by unchecking "Show Additional Data" in the indicator settings or reduce text size by changing the "Table Text Size" parameter.
Aggregate volume can be displayed directly on the graph (this volume can be displayed on any asset, such as Ethereum itself). The display can be disabled in the settings.
BTC outperform atrategy### Code Description
This Pine Script™ code implements a simple trading strategy based on the relative prices of Bitcoin (BTC) on a weekly and a three-month basis. The script plots the weekly and three-month closing prices of Bitcoin on the chart and generates trading signals based on the comparison of these prices. The code can also be applied to Ethereum (ETH) with similar effectiveness.
### Explanation
1. **Inputs and Variables**:
- The user selects the trading symbol (default is "BINANCE:BTCUSDT").
- `weeklyPrice` retrieves the closing price of the selected symbol on a weekly interval.
- `monthlyPrice` retrieves the closing price of the selected symbol on a three-month interval.
2. **Plotting Data**:
- The weekly price is plotted in blue.
- The three-month price is plotted in red.
3. **Trading Conditions**:
- A long position is suggested if the weekly price is greater than the three-month price.
- A short position is suggested if the three-month price is greater than the weekly price.
4. **Strategy Execution**:
- If the long condition is met, the strategy enters a long position.
- If the short condition is met, the strategy enters a short position.
This script works equally well for Ethereum (ETH) by changing the symbol input to "BINANCE:ETHUSDT" or any other desired Ethereum trading pair.

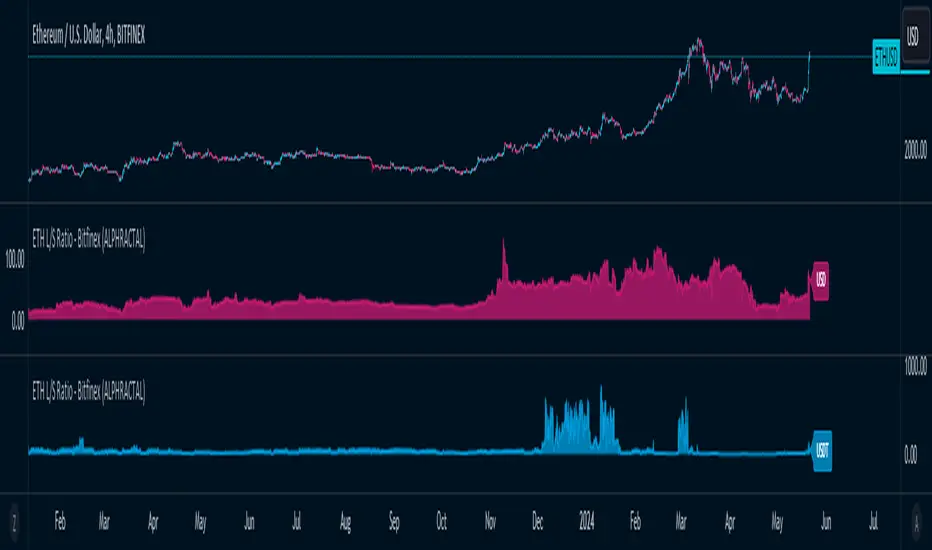
ETH Long/Short Ratio BITFINEX - (ALPHRACTAL)Indicator Description: ETH Long/Short Ratio BITFINEX - (ALPHRACTAL)
The ETH Long/Short Ratio BITFINEX - (ALPHRACTAL) indicator provides a detailed analysis of Ethereum (ETH) long and short positions in USD and USDT on the Bitfinex exchange. This indicator is ideal for traders who want to monitor market behavior and better understand the relationship between long and short positions.
Features:
USD and USDT Long/Short Ratio:
Calculates and displays the ratio between long and short ETH positions in USD and USDT.
Helps identify market trends and the relative strength between buyers and sellers.
Color Configuration:
Allows customization of chart colors for clear and distinct visualization of USD and USDT ratios.
Uses colors with adjustable transparency to enhance chart visibility.
Label Display:
Option to show or hide labels indicating the type of ratio (USD or USDT) at the latest chart value.
Labels are useful for quickly identifying the visualized ratio.
Display Control:
Option to enable or disable the display of individual USD and USDT ratio charts.
Flexibility to view only the relevant data for your analysis.
How to Use:
Add the indicator to your chart to visualize the long/short ratios of ETH in USD and USDT.
Adjust colors and transparency as per your preference for better visual distinction.
Use the option to show or hide labels for quick identification of the data.
Analyze the relationship between long and short positions to make informed trading decisions, observing market buying and selling trends.
Example Use Cases:
Market Sentiment Analysis: An increase in the Long/Short ratio may indicate bullish sentiment among traders, while a decrease may indicate bearish sentiment.
Identifying Opportunities: Significant discrepancies between USD and USDT ratios may signal arbitrage opportunities or alert to significant market movements.
This indicator is a powerful tool for Ethereum traders who want a deeper understanding of market behavior and the dynamics of long and short positions on Bitfinex. Add the ETH Long/Short Ratio BITFINEX - (ALPHRACTAL) to your technical analysis toolkit and gain an edge in your trading strategy.
Heikin Ashi RSI + OTT [Erebor]Relative Strength Index (RSI)
The Relative Strength Index (RSI) is a popular momentum oscillator used in technical analysis to measure the speed and change of price movements. Developed by J. Welles Wilder, the RSI is calculated using the average gains and losses over a specified period, typically 14 days. Here's how it works:
Description and Calculation:
1. Average Gain and Average Loss Calculation:
- Calculate the average gain and average loss over the chosen period (e.g., 14 days).
- The average gain is the sum of gains divided by the period, and the average loss is the sum of losses divided by the period.
2. Relative Strength (RS) Calculation:
- The relative strength is the ratio of average gain to average loss.
The RSI oscillates between 0 and 100. Traditionally, an RSI above 70 indicates overbought conditions, suggesting a potential sell signal, while an RSI below 30 suggests oversold conditions, indicating a potential buy signal.
Pros of RSI:
- Identifying Overbought and Oversold Conditions: RSI helps traders identify potential reversal points in the market due to overbought or oversold conditions.
- Confirmation Tool: RSI can be used in conjunction with other technical indicators or chart patterns to confirm signals, enhancing the reliability of trading decisions.
- Versatility: RSI can be applied to various timeframes, from intraday to long-term charts, making it adaptable to different trading styles.
Cons of RSI:
- Whipsaws: In ranging markets, RSI can generate false signals, leading to whipsaws (rapid price movements followed by a reversal).
- Not Always Accurate: RSI may give false signals, especially in strongly trending markets where overbought or oversold conditions persist for extended periods.
- Subjectivity: Interpretation of RSI levels (e.g., 70 for overbought, 30 for oversold) is somewhat subjective and can vary depending on market conditions and individual preferences.
Checking RSIs in Different Periods:
Traders often use multiple timeframes to analyze RSI for a more comprehensive view:
- Fast RSI (e.g., 8-period): Provides more sensitive signals, suitable for short-term trading and quick decision-making.
- Slow RSI (e.g., 32-period): Offers a smoother representation of price movements, useful for identifying longer-term trends and reducing noise.
By comparing RSI readings across different periods, traders can gain insights into the momentum and strength of price movements over various timeframes, helping them make more informed trading decisions. Additionally, divergence between fast and slow RSI readings may signal potential trend reversals or continuation patterns.
Heikin Ashi Candles
Let's consider a modification to the traditional “Heikin Ashi Candles” where we introduce a new parameter: the period of calculation. The traditional HA candles are derived from the open 01, high 00 low 00, and close 00 prices of the underlying asset.
Now, let's introduce a new parameter, period, which will determine how many periods are considered in the calculation of the HA candles. This period parameter will affect the smoothing and responsiveness of the resulting candles.
In this modification, instead of considering just the current period, we're averaging or aggregating the prices over a specified number of periods . This will result in candles that reflect a longer-term trend or sentiment, depending on the chosen period value.
For example, if period is set to 1, it would essentially be the same as traditional Heikin Ashi candles. However, if period is set to a higher value, say 5, each candle will represent the average price movement over the last 5 periods, providing a smoother representation of the trend but potentially with delayed signals compared to lower period values.
Traders can adjust the period parameter based on their trading style, the timeframe they're analyzing, and the level of smoothing or responsiveness they prefer in their candlestick patterns.
Optimized Trend Tracker
The "Optimized Trend Tracker" is a proprietary trading indicator developed by TradingView user ANIL ÖZEKŞİ. It is designed to identify and track trends in financial markets efficiently. The indicator attempts to smooth out price fluctuations and provide clear signals for trend direction.
The Optimized Trend Tracker uses a combination of moving averages and adaptive filters to detect trends. It aims to reduce lag and noise typically associated with traditional moving averages, thereby providing more timely and accurate signals.
Some of the key features and applications of the OTT include:
• Trend Identification: The indicator helps traders identify the direction of the prevailing trend in a market. It distinguishes between uptrends, downtrends, and sideways consolidations.
• Entry and Exit Signals: The OTT generates buy and sell signals based on crossovers and direction changes of the trend. Traders can use these signals to time their entries and exits in the market.
• Trend Strength: It also provides insights into the strength of the trend by analyzing the slope and momentum of price movements. This information can help traders assess the conviction behind the trend and adjust their trading strategies accordingly.
• Filter Noise: By employing adaptive filters, the indicator aims to filter out market noise and false signals, thereby enhancing the reliability of trend identification.
• Customization: Traders can customize the parameters of the OTT to suit their specific trading preferences and market conditions. This flexibility allows for adaptation to different timeframes and asset classes.
Overall, the OTT can be a valuable tool for traders seeking to capitalize on trending market conditions while minimizing false signals and noise. However, like any trading indicator, it is essential to combine its signals with other forms of analysis and risk management strategies for optimal results. Additionally, traders should thoroughly back-test the indicator and practice using it in a demo environment before applying it to live trading.
The following types of moving average have been included: "SMA", "EMA", "SMMA (RMA)", "WMA", "VWMA", "HMA", "KAMA", "LSMA", "TRAMA", "VAR", "DEMA", "ZLEMA", "TSF", "WWMA". Thanks to the authors.
Thank you for your indicator “Optimized Trend Tracker”. © kivancozbilgic
Thank you for your programming language, indicators and strategies. © TradingView
Kind regards.
© Erebor_GIT

Aroon and ASH strategy - ETHERIUM [IkkeOmar]Intro:
This post introduces a Pine Script strategy, as an example if anyone needs a push to get started. This example is a strategy on ETH, obviously it isn't a good strategy, and I wouldn't share my own good strategies because of alpha decay. This strategy combines two technical indicators: Aroon and Absolute Strength Histogram (ASH).
Overview:
The strategy employs the Aroon indicator alongside the Absolute Strength Histogram (ASH) to determine market trends and potential trade setups. Aroon helps identify the strength and direction of a trend, while ASH provides insights into the strength of momentum. By combining these indicators, the strategy aims to capture profitable trading opportunities in Ethereum markets. Normally when developing strats using indicators, you want to find some good indicators, but you NEED to understand their strengths and weaknesses, other indicators can be incorporated to minimize the downs of another indicator. Try to look for synergy in your indicators!
Indicator settings:
Aroon Indicator:
- Two sets of parameters are used for the Aroon indicator:
- For Long Positions: Aroon periods are set to 56 (upper) and 20 (lower).
- For Short Positions: Aroon periods are set to 17 (upper) and 55 (lower).
Absolute Strength Histogram (ASH):
ASH is calculated with a length of 9 bars using the closing price as the data source.
Trading Conditions:
The strategy incorporates specific conditions to initiate and exit trades:
Start Date:
Traders can specify the start date for backtesting purposes.
Trade Direction:
Traders can select the desired trade direction: Long, Short, or Both.
Entry and Exit Conditions:
1. Long Position Entry: A long position is initiated when the Aroon indicator crosses over (crossover) the lower Aroon threshold, indicating a potential uptrend.
2. Long Position Exit: A long position is closed when the Aroon indicator crosses under (crossunder) the lower Aroon threshold.
3. Short Position Entry: A short position is initiated when the Aroon indicator crosses under (crossunder) the upper Aroon threshold, signaling a potential downtrend.
4. Short Position Exit: A short position is closed when the Aroon indicator crosses over (crossover) the upper Aroon threshold.
Disclaimer:
THIS ISN'T AN OPTIMAL STRATEGY AT ALL! It was just an old project from when I started learning pine script!
The backtest doesn't promise the same results in the future, always do both in-sample and out-of-sample testing when backtesting a strategy. And make sure you forward test it as well before implementing it!

Comparison with BTC (RSI)显示当前品种与BTC汇率对的RSI值
以此判断强势或弱势品种以及超买超卖
——————————
Display the RSI value of the exchange rate between the current variety and BTC
Use this to determine strong or weak varieties, as well as overbought and oversold

Crypto Trend IndicatorThe Crypto Trend Indicator is a trend-following indicator specifically designed to identify bullish and bearish trends in the price of Bitcoin, and other cryptocurrencies. This indicator doesn't provide explicit instructions on when to buy or sell, but rather offers an understanding of whether the trend is bullish or bearish. It's important to note that this indicator is only useful for trend trading.
The band is a visual representation of the 30-day and 60-day Exponential Moving Average (EMA). When the 30-day EMA is above the 60-day EMA, the trend is bullish and the band is green. When the 30-day EMA is below the 60-day EMA, the trend is bearish and the band is red. When the 30-day EMA starts to converge with the 60-day EMA, the trend is neutral and the band is grey.
The line is a visual representation of the 20-week Simple Moving Average (SMA) in the daily timeframe. "Bull" and "Bear" signals are generated when the 20-day EMA is either above or below the 20-week SMA, in conjunction with a bullish or bearish trend. When the band is green and the 20-day EMA is above the 20-week SMA, a “Bull” signal emerges. When the band is red and the 20-day EMA is below the 20-week SMA, a “Bear” signal emerges. The 20-week SMA can potentially also function as a leading indicator, as substantial price deviations from the SMA typically indicate an overextended market.
While this indicator has traditionally identified bullish and bearish trends in various cryptocurrency assets, past performance does not guarantee future results. Therefore, it is advisable to supplement this indicator with other technical tools. For instance, range-bound indicators can greatly improve the decision-making process when planning for entries and exits points.

Cryptocurrency Market Sentiment v1.0Introduction:
Capable of observing the market sentiment of the cryptocurrency market
The relative status of BTC and altcoins
How it works:
1. The general uptrend process of the cryptocurrency market is BTC → ETH → high-cap altcoins → low-cap altcoins. When funds cannot push up BTC's market cap, funds gradually flow into smaller-cap altcoins until the upward trend ends.
2. Select ETH as the representative of altcoins, and understand the sentiment and current stage
3. Mathematical principle : divide the price of ETH by the price of BTC, and then apply it to the RSI formula .
How to use it:
1. Similar to the RSI indicator , when CMS enters the overbought zone, it represents an active altcoin market, a passionate market sentiment , and the end of the uptrend.
2. When CMS enters the oversold zone, it indicates the leading stage of BTC in the rising trend or the capital flow back to BTC in the declining process .
3. If CMS is at a low level, long positions should focus on altcoins, and short positions should focus on BTC, and vice versa.
----------------------------------------------------------------------------------------------------------
简单介绍:
能够观察加密市场市场情绪
BTC和寨币的相对状态
如何工作:
1、加密市场一般的上涨过程为 BTC → ETH → 大市值山寨 → 小市值山寨,当资金无法推动大市值的BTC上涨时,资金就会逐渐流向市值较小的山寨,直到一轮上涨结束。
2、选取ETH作为altcoins的代表,通过ETH与BTC的关系来了解加密市场的情绪和目前上涨的阶段。
3、数学原理:将ETH的价格/BTC的价格,随后将其带入RSI公式
如何使用:
1、与RSI指标类似,当cms进入超买时,代表寨币市场的活跃,市场情绪热烈,上涨进入尾声。
2、当cms进入超卖时,为上涨中BTC领涨的阶段或下降过程中资金回流BTC。
3、如果cms在低位,做多应关注altcoins,做空应关注btc,反之亦然。

Short Term Bubble RiskThis risk indicator uses the extension of the closing price to the 20W SMA and displays a color-coded risk oscillator. The higher the oscillator is, the greater the short-term risk and vice-versa. This indicator has historically worked well for estimating the short-term risk of Bitcoin and Ethereum on a weekly timeframe.

Customizable Moving Average RibbonThis indicator is a highly customizable moving average ribbon with some unique features.
This script can utilize multiple unique sources, including a non-repainting renko closing price. Renko charts focus solely on price movement and minimize the impacts of time and the extra noise time creates. Employing the renko close helps smooth out the MA ribbon. Insignificant price movements will not cause a change in the plotted lines of the indicator unless a new threshold is breached or a "brick" is created. This is highly useful for quickly identifying consolidation areas or overall flat price movement.
There are two methods for selecting the box size when utilizing the renko source. Box size is critical for the overall function and efficacy of the plots you will visually see with this indicator. Box size is set automatically using the Average True Range "ATR" or manually using the "Traditional" setting. The simplest way to determine a manual box size is to take the ATR of the given instrument and round it to the nearest decimal place. As an example, if the ATR for the asset is 0.18, you would round that number to 0.2 and utilize this as your traditional box size.
The MA ribbon contains eleven adjustable moving average lines. Users can choose to turn off as many as they would like. Users can also adjust the length of the individual moving averages and the source for all moving averages. There are nine types of moving averages to choose from for the ribbon. The MA options are:
Exponential Moving Average = 'EMA'
Double Exponential Moving Average= 'DEMA'
Triple Exponential Moving Average = 'TEMA'
Simple Moving Average = 'SMA'
Relative Moving Average = 'RMA'
Volume Weighted Moving Average = 'VWMA'
Weighted Moving Average = 'WMA'
Smoothed Simple Moving Average = 'SSMA'
Hull Moving Average = 'HULL'
We believe that the ribbons features, including the line color change, help quickly identify trends and give users optimum customization. Users can select from five different color schemes including:
Green/Red
Purple/White
White/Blue
Silver / Orange
Teal/ Orange

Price Distance RatioThis study plots the ratio between current price and the price N days ago.
With N input that is configurable, users can find optimal long/short entries when price is in an established trend and price has diverge far from a given local peak or all time high.
With many years of stock trading the analysis indicates a connection between the distance of price and subsequent returns.
Portfolios of stocks with lower price to local highes ratios generally underperformed portfolios of stocks with higher prices to peaks reached similar N days ago.
The highest returns to previous peak are recorded when buying at the biggest dip.
For example, the purchase at 20% drawdown could generate 25% when price returns to the peak. The purchase at 50% drawdown could generate bigger, i.e. 100% return, when price returns to the peak. And the purchase at 90% drawdown could generate much bigger, i.e. 900% return, in a case the price returns to the peak.
However, buying very far below local peaks on almost all holding periods produces lower CAGR returns because of "timing adjustment". In simple words, typically the drawdown takes less time vs. further recovery.
For example:
👉 The largest BTC drawdown in 2013-2015 took 410 days (Peak-to-Valley) . And the recovery of BTC to new highs took 771 days (Valley-to-Peak) after that.
👉 The 3rd longest drawdown in BTC took 363 days (observed from December 17, 2017 to December 15, 2018). And further recovery in BTC to its new high took almost two years - 716 days .
👉The 4th longest drawdown in BTC took 162 days (observed from June 08, 2011 to November 17, 2011). And further recovery in BTC to its new high took more than a year - 469 days .
The concept of this study could recognizes at least 4 different modes of action.
👉 In a clearly established upward trend traders should be buying (following the trend) when Ratio is above 100% and reducing the size when Ratio turns below 100%.
👉 Conversely, in a clearly established downward trend traders should be shorted when Ratio is below 100% and covering when the Ratio turns back to 100%.
👉 In a sideways movement traders are advised to wait carefully if the Ratio near 100% for a long time, and take a position the trend is clear.
👉 Chartists can analyze the dynamic of the indicator - both in terms of trends and overall level. For example as it shown at the chart.
The understading of the study and rules of "timing adjustments" could genarate the awesome opportunities for stock options traders also, with strategies of selling uncovered call options and vertical call spreads.
// Many thanks to @HPotter and @Wheeelman wizards for their continious support and assistance.

Stablecoins DominanceStablecoins Dominance
The purpose of the script is to show Stablecoin's strength in the crypto markets.
5 Largest Stablecoins divided by Total Market Cap
Altcoin Dominance (without ETH) Excluding Stablecoins UnsymetricAltcoin Dominance (without ETH) Excluding Stablecoins Unsymetric
The purpose of the script is to show Altcoin's strength without Ethereum once we exclude stablecoins.
So we look into all altcoins besides eth and besides stablecoins divided by a value of eth+btc

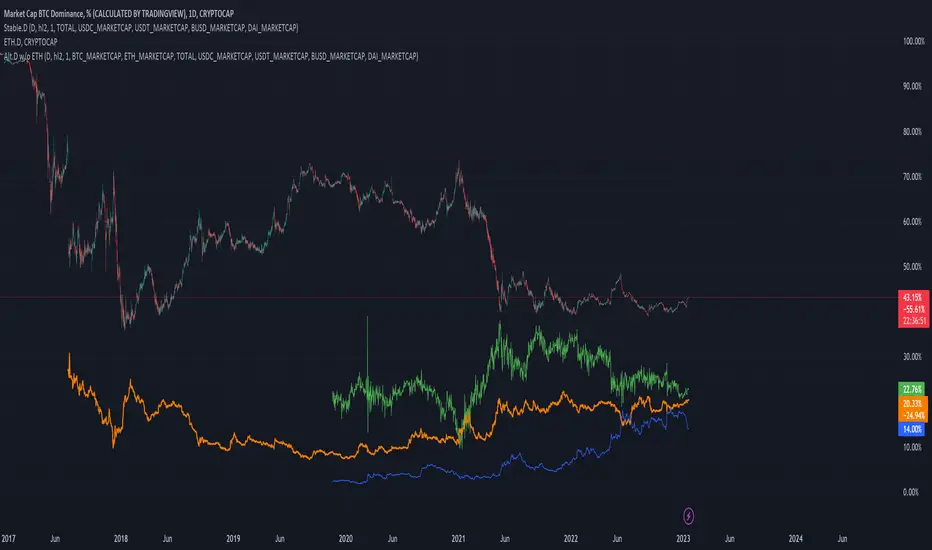
Altcoin Dominance Excluding EthereumAltcoin Dominance Excluding Ethereum
The purpose of the script is to show Altcoin's strength without Ethereum.
Pretty much shows Altcoin's Dominance in comparison to Market Cap once we exclude Ethereum.

ETH Dominance Excluding StablecoinsETH Dominance Excluding Stablecoins.
The purpose of the script is to show Ethereum's strength relative to other cryptocurrencies.
Pretty much shows ETH Dominance in comparison to Market Cap once we exclude the 5 largest stablecoins.
