PROTECTED SOURCE SCRIPT
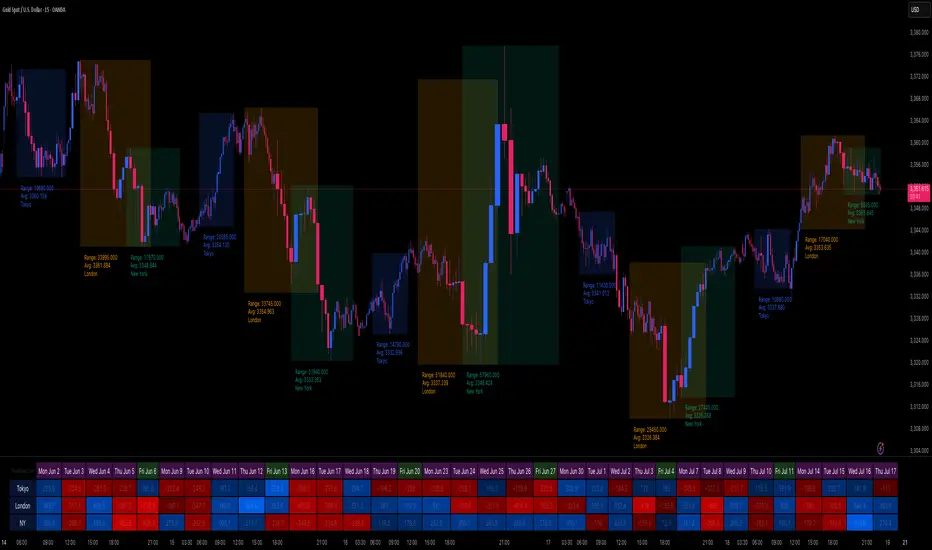
Session Volatility Dashboard
█ Session Volatility Dashboard: HOW IT WORKS
This tool is built on transparent, statistically-grounded principles to ensure reliability and build user trust.
█ ACTIONABLE INTELLIGENCE: TRADING STRATEGIES & USE CASES
Translate data into action with these practical trading concepts.
█ COMPLETE CUSTOMIZATION: SETTINGS
Session Times: Independently set the start and end times for Asia, London, and New York sessions.
Timezone: Select your preferred UTC offset to align all sessions correctly.
Volatility Lookback: Define the number of past sessions to use for calculating the average volatility baseline (default is 20).
Dashboard Settings: Choose the on-screen position of the table, text size, and colors.
Visual Elements: Toggle on/off session background colors, high/low lines, and midpoint lines. Customize all colors.
Alerts: Enable/disable and customize alerts for session high/low breaks and volatility threshold crossings.
This tool is built on transparent, statistically-grounded principles to ensure reliability and build user trust.
- Session Logic: The script accurately identifies session periods based on user-defined start and end times in conjunction with the selected UTC offset. This ensures the session boxes and data are correctly aligned regardless of your local timezone or daylight saving changes.
- Volatility Calculation: The core of the volatility engine is a comparison of current and historical price action. The script calculates a rolling Average True Range (ATR) over a user-defined lookback period (e.g., the last 20 sessions). It then compares the current session's ATR to this historical baseline to generate a simple percentage. For example, a reading of "135%" indicates the current session is 35% more volatile than the recent average, while "80%" indicates a contraction in volatility.
- Dashboard Population: The script leverages TradingView's table object to construct the dashboard. This powerful feature allows the data to be displayed in a fixed position on the screen (e.g., top-right corner). Unlike plotted text, this table does not scroll with the chart's price history, ensuring that the most critical, up-to-date information is always available at a glance.
█ ACTIONABLE INTELLIGENCE: TRADING STRATEGIES & USE CASES
Translate data into action with these practical trading concepts.
- Strategy 1: The Breakout Trade: Identify a session with low, coiling volatility (e.g., a Volatility reading below 75%)—often the Asian session. Mark the session high and low plotted by the indicator. These levels become prime targets for a potential breakout trade during the high-volume, high-volatility open of the subsequent London session.
- Strategy 2: The Mean Reversion (Fade) Trade: In a session with extremely high volatility (e.g., >150% of average), watch for price to rapidly extend to a new session high or low and then print a clear reversal candlestick pattern (like a pin bar or engulfing candle). This can signal momentum exhaustion and a high-probability opportunity to "fade" the move back toward the session midpoint.
- Strategy 3: The Trend Continuation: During a clear trending day, use the session midpoint as a dynamic area of value. Look for price to pull back to the midpoint during the London or New York session. If the session's Bias in the dashboard remains aligned with the higher-timeframe trend, this can present a quality entry to rejoin the established momentum.
█ COMPLETE CUSTOMIZATION: SETTINGS
Session Times: Independently set the start and end times for Asia, London, and New York sessions.
Timezone: Select your preferred UTC offset to align all sessions correctly.
Volatility Lookback: Define the number of past sessions to use for calculating the average volatility baseline (default is 20).
Dashboard Settings: Choose the on-screen position of the table, text size, and colors.
Visual Elements: Toggle on/off session background colors, high/low lines, and midpoint lines. Customize all colors.
Alerts: Enable/disable and customize alerts for session high/low breaks and volatility threshold crossings.
Korumalı komut dosyası
Bu komut dosyası kapalı kaynak olarak yayınlanmaktadır. Ancak, ücretsiz ve herhangi bir sınırlama olmaksızın kullanabilirsiniz – daha fazla bilgiyi buradan edinebilirsiniz.
ForexGran
Feragatname
Bilgiler ve yayınlar, TradingView tarafından sağlanan veya onaylanan finansal, yatırım, alım satım veya diğer türden tavsiye veya öneriler anlamına gelmez ve teşkil etmez. Kullanım Koşulları bölümünde daha fazlasını okuyun.