OPEN-SOURCE SCRIPT
Grids lines
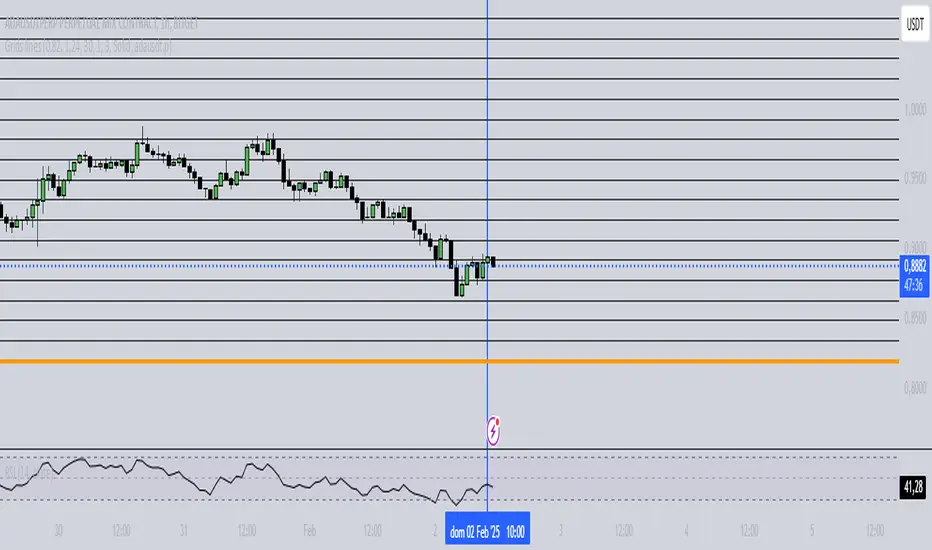
"Líneas de Grid para Análisis Técnico"
Este indicador dibuja líneas de grid (rejilla) en el gráfico de precios, lo que puede ayudar a visualizar zonas de soporte, resistencia y niveles de interés en un rango de precios determinado.
Características:
Precio Mínimo y Máximo: Configura los precios entre los cuales se dibujarán las líneas de grid.
Número de Grids: Establece cuántas líneas de grid quieres ver en el gráfico.
Color y Grosor de las Líneas: Personaliza los colores y el grosor de las líneas de grid, incluyendo la primera y la última línea.
Estilo de las Líneas: Puedes elegir entre líneas discontinuas (Dotted) o sólidas (Solid), para personalizar aún más tu visualización.
Ticker Específico: Si lo deseas, puedes elegir un ticker específico para dibujar las líneas solo cuando el gráfico esté mostrando ese activo. De lo contrario, las líneas se dibujarán en el gráfico actual.
Parámetros:
Precio Mínimo: El precio más bajo para el rango del grid (por ejemplo: 0.82).
Precio Máximo: El precio más alto para el rango del grid (por ejemplo: 1.24).
Número de Grids: Define cuántas líneas quieres entre el precio mínimo y el máximo (por ejemplo: 30).
Estilo de Línea: Elige entre Dotted (líneas discontinuas) o Solid (líneas sólidas).
Ticker: Si deseas dibujar las líneas solo para un ticker específico, ingresa el símbolo del ticker (por ejemplo, ADAUSDT). Si dejas este campo vacío, las líneas se dibujarán en el gráfico actual.
Ejemplo de Uso:
Si estás analizando el par ADAUSDT, puedes escribir ADAUSDT en el campo del ticker para que las líneas solo se dibujen cuando este par esté visible. Si dejas el campo vacío, las líneas se dibujarán en cualquier ticker que tengas en el gráfico.
Descripción en Inglés:
"Grid Lines for Technical Analysis"
This indicator draws grid lines on the price chart, helping to visualize support, resistance, and key levels within a specific price range.
Features:
Min and Max Price: Set the price range for the grid lines to be drawn.
Number of Grids: Choose how many grid lines you want to display on the chart.
Line Color and Thickness: Customize the color and thickness of the grid lines, including the first and last line.
Line Style: Choose between Dotted (dashed lines) or Solid (solid lines) to further customize your view.
Specific Ticker: If desired, you can specify a ticker for the grid lines to only be drawn when that asset is shown. Otherwise, the lines will be drawn on the current chart.
Parameters:
Min Price: The lowest price for the grid range (for example, 0.82).
Max Price: The highest price for the grid range (for example, 1.24).
Number of Grids: Defines how many lines you want between the minimum and maximum price (for example, 30).
Line Style: Choose between Dotted or Solid.
Ticker: To draw the lines only for a specific ticker, enter the symbol of the ticker (for example, ADAUSDT). If left blank, the lines will be drawn on the current ticker.
Usage Example:
If you're analyzing the pair ADAUSDT, you can enter ADAUSDT in the ticker field to draw the lines only when that pair is visible. If you leave the field blank, the lines will be drawn for any ticker currently on the chart.
Açık kaynak kodlu komut dosyası
Gerçek TradingView ruhuyla, bu komut dosyasının mimarı, yatırımcıların işlevselliğini inceleyip doğrulayabilmesi için onu açık kaynaklı hale getirdi. Yazarı tebrik ederiz! Ücretsiz olarak kullanabilseniz de, kodu yeniden yayınlamanın Topluluk Kurallarımıza tabi olduğunu unutmayın.
Feragatname
Bilgiler ve yayınlar, TradingView tarafından sağlanan veya onaylanan finansal, yatırım, alım satım veya diğer türden tavsiye veya öneriler anlamına gelmez ve teşkil etmez. Kullanım Koşulları bölümünde daha fazlasını okuyun.