OPEN-SOURCE SCRIPT
Güncellendi Modified Mannarino Market Risk Indicator & Bubbles
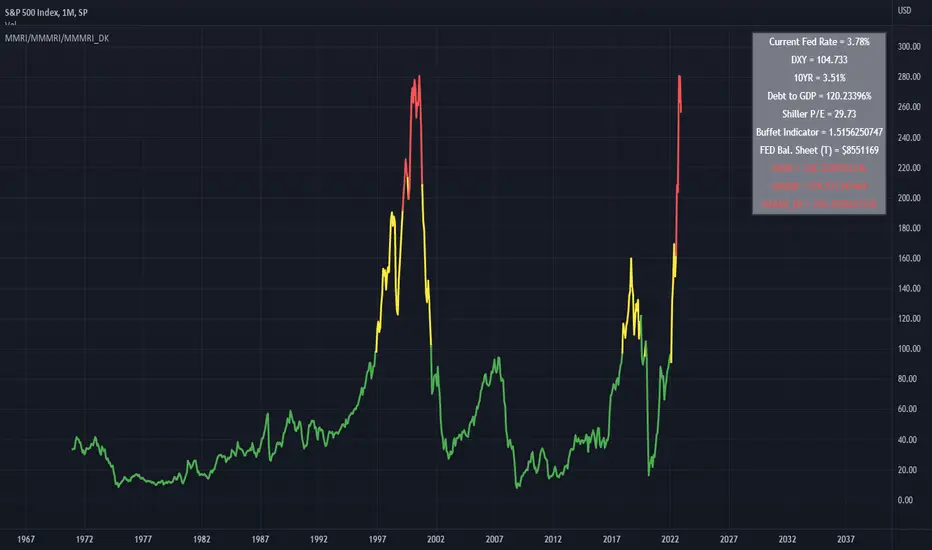
Modified Mannarino Market Risk Indicator
MMRI = DXY * 10Y Yield
MMMRI = MMRI * (Debt/GDP)
- Color Indicators
Green ~ Low Risk
Yellow - Mod Risk
Red - High Risk
Purple - Extreme Risk
*
Bubbles Formula (MMMRI_DK)
DXY*(10Y + FED Rate)* (Shiller P/E Ratio) * (Warren Buffet Indicator)*(Debt/GDP) /1.61
Similar to the Shiller P/E Ratio - you need to look back to see where the bubbles were. The difference between the Dot Com bubble and subsequent ones is that we now have QE which is why I included the FED Rate + 10Y.
*Color Indicators
Green ~ Low Risk
Yellow - Mod Risk
Red - High Risk
Purple - Extreme Risk
Future Bubbles Formula (MMMRI_DK_Fut)
DXY*(10Y + Future FED Rate)* (Shiller P/E Ratio) * (Warren Buffet Indicator)*(Debt/GDP) /1.61
Assumes that the 10Y is fixed but what is important is that you will get an idea on when the system may pop.
Sürüm Notları
Bug FixAçık kaynak kodlu komut dosyası
Gerçek TradingView ruhuna uygun olarak, bu komut dosyasının oluşturucusu bunu açık kaynaklı hale getirmiştir, böylece yatırımcılar betiğin işlevselliğini inceleyip doğrulayabilir. Yazara saygı! Ücretsiz olarak kullanabilirsiniz, ancak kodu yeniden yayınlamanın Site Kurallarımıza tabi olduğunu unutmayın.
Feragatname
Bilgiler ve yayınlar, TradingView tarafından sağlanan veya onaylanan finansal, yatırım, işlem veya diğer türden tavsiye veya tavsiyeler anlamına gelmez ve teşkil etmez. Kullanım Şartları'nda daha fazlasını okuyun.
Açık kaynak kodlu komut dosyası
Gerçek TradingView ruhuna uygun olarak, bu komut dosyasının oluşturucusu bunu açık kaynaklı hale getirmiştir, böylece yatırımcılar betiğin işlevselliğini inceleyip doğrulayabilir. Yazara saygı! Ücretsiz olarak kullanabilirsiniz, ancak kodu yeniden yayınlamanın Site Kurallarımıza tabi olduğunu unutmayın.
Feragatname
Bilgiler ve yayınlar, TradingView tarafından sağlanan veya onaylanan finansal, yatırım, işlem veya diğer türden tavsiye veya tavsiyeler anlamına gelmez ve teşkil etmez. Kullanım Şartları'nda daha fazlasını okuyun.