OPEN-SOURCE SCRIPT
SB_Wavetrend_Oscillator
A take on LazyBear's Wavetrend_Oscillator
The idea is bit modified.
Original Idea:
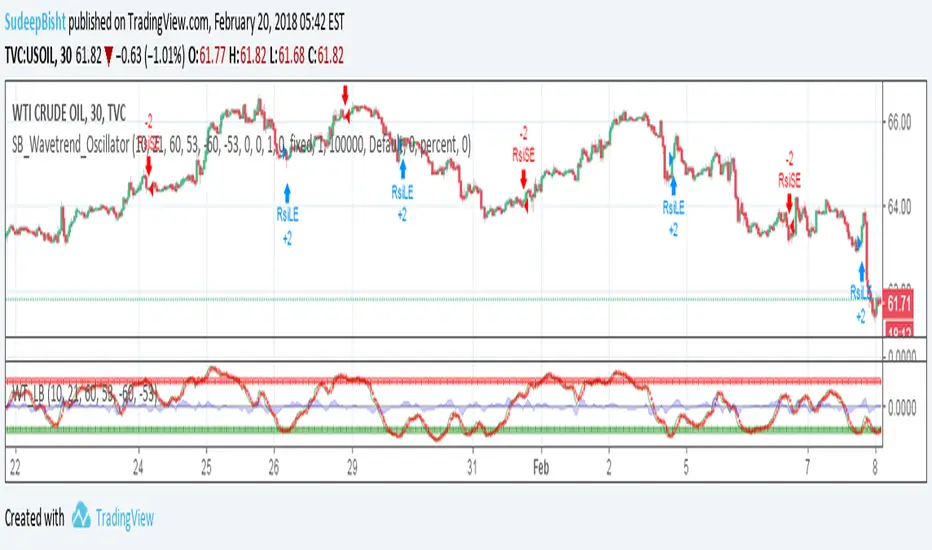
When the oscillator is above the overbought band (red lines) and crosses down the signal (dotted line), it is usually a good SELL signal. Similarly, when the oscillator crosses above the signal when below the Oversold band (green lines), it is a good BUY signal.
Modified Idea:
Carrying the original idea, if the oscillator crosses the overbought band (red lines) and crosses down the signal (dotted line) twice without crossing the Oversold band (green lines) and crosses above the signal (dotted line), a buy or sell signal will take place when the oscillator crosses the dotted line and the value of oscillator is >0(if sell order is to be placed) and <0(if buy order is to be placed).
For the original idea you can refer to:
![Indicator: WaveTrend Oscillator [WT]](https://s3.tradingview.com/2/2KE8wTuF_mid.png)
Let me know if any refinements could improve the oscillator.
The idea is bit modified.
Original Idea:
When the oscillator is above the overbought band (red lines) and crosses down the signal (dotted line), it is usually a good SELL signal. Similarly, when the oscillator crosses above the signal when below the Oversold band (green lines), it is a good BUY signal.
Modified Idea:
Carrying the original idea, if the oscillator crosses the overbought band (red lines) and crosses down the signal (dotted line) twice without crossing the Oversold band (green lines) and crosses above the signal (dotted line), a buy or sell signal will take place when the oscillator crosses the dotted line and the value of oscillator is >0(if sell order is to be placed) and <0(if buy order is to be placed).
For the original idea you can refer to:
Let me know if any refinements could improve the oscillator.
Açık kaynak kodlu komut dosyası
Gerçek TradingView ruhuyla, bu komut dosyasının mimarı, yatırımcıların işlevselliğini inceleyip doğrulayabilmesi için onu açık kaynaklı hale getirdi. Yazarı tebrik ederiz! Ücretsiz olarak kullanabilseniz de, kodu yeniden yayınlamanın Topluluk Kurallarımıza tabi olduğunu unutmayın.
Feragatname
Bilgiler ve yayınlar, TradingView tarafından sağlanan veya onaylanan finansal, yatırım, alım satım veya diğer türden tavsiye veya öneriler anlamına gelmez ve teşkil etmez. Kullanım Koşulları bölümünde daha fazlasını okuyun.