OPEN-SOURCE SCRIPT
Indicator: WaveTrend Oscillator [WT]
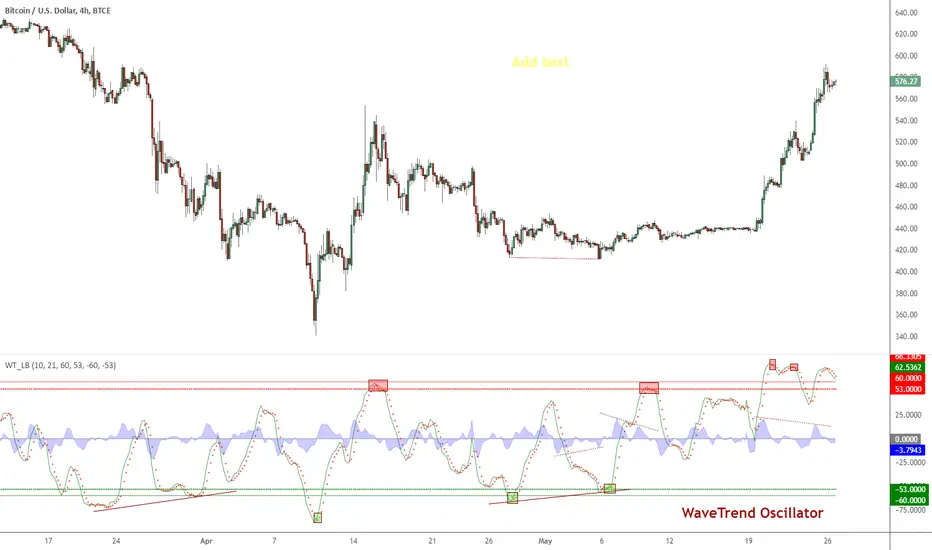
WaveTrend Oscillator is a port of a famous TS/MT indicator.
When the oscillator is above the overbought band (red lines) and crosses down the signal (dotted line), it is usually a good SELL signal. Similarly, when the oscillator crosses above the signal when below the Oversold band (green lines), it is a good BUY signal.
I have marked some cross-overs in the above chart. As you can see, they are *not* the only useful signals WT generates. Try it on your instrument and let me know what you think.
Açık kaynak kodlu komut dosyası
Gerçek TradingView ruhuna uygun olarak, bu komut dosyasının oluşturucusu bunu açık kaynaklı hale getirmiştir, böylece yatırımcılar betiğin işlevselliğini inceleyip doğrulayabilir. Yazara saygı! Ücretsiz olarak kullanabilirsiniz, ancak kodu yeniden yayınlamanın Site Kurallarımıza tabi olduğunu unutmayın.
List of my free indicators: bit.ly/1LQaPK8
List of my indicators at Appstore: blog.tradingview.com/?p=970
List of my indicators at Appstore: blog.tradingview.com/?p=970
Feragatname
Bilgiler ve yayınlar, TradingView tarafından sağlanan veya onaylanan finansal, yatırım, işlem veya diğer türden tavsiye veya tavsiyeler anlamına gelmez ve teşkil etmez. Kullanım Şartları'nda daha fazlasını okuyun.