OPEN-SOURCE SCRIPT
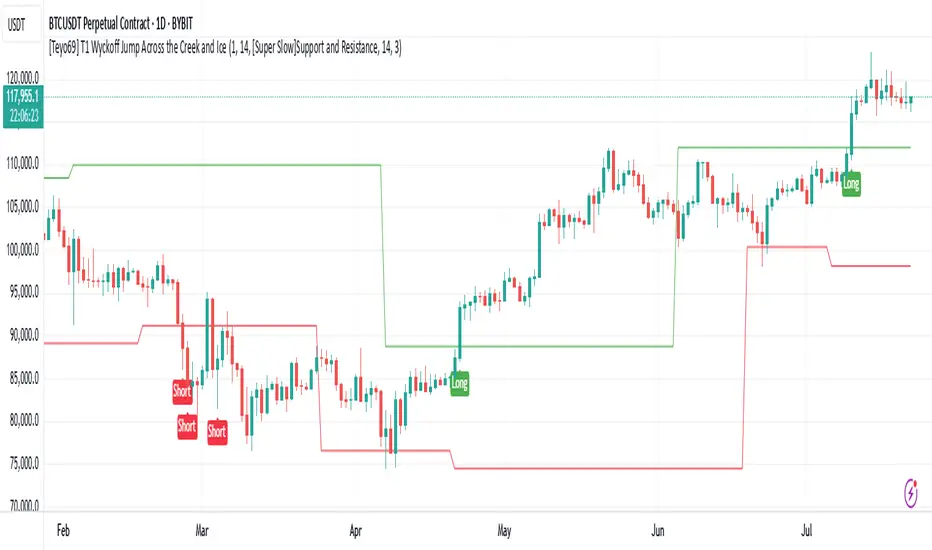
[Teyo69] T1 Wyckoff Jump Across the Creek and Ice

📌 Overview
This indicator captures Wyckoff-style breakouts:
🧩 Features
📈 Super Trend
📉 EMA
🪨 [Super Slow] Support & Resistance
📊 Linear Regression
⚙️ How to Use
🎛️ Configuration
Indicator Leniency - Signal tolerance range after breakout
S&R Length - Pivot detection length for S/R method
Trend Method - Choose how trend is calculated
Volume SMA - Baseline for volume spike detection
Volume Length - Lookback for volume rising check
🧪 Signal Conditions
JAC Direction flips bullish + volume rising + spike
JAI Direction flips bearish + volume rising + spike
⚠️ Limitations
🔧 Advanced Tips
📝 Notes
This indicator captures Wyckoff-style breakouts:
- JAC (Jump Across the Creek) for bullish structure breakouts
- JAI (Jump Across the Ice) for bearish breakdowns
- It blends support/resistance logic, volume behavior, and slope/momentum from selected trend-following methods.
🧩 Features
- Detects JAC (bullish breakout) and JAI (bearish breakdown) based on trend breakouts confirmed by volume.
- Supports multiple trend logic modes:
📈 Super Trend
📉 EMA
🪨 [Super Slow] Support & Resistance
📊 Linear Regression
- Dynamically plots Creek (resistance) and Ice (support)
- Incorporates volume spike and rising volume conditions for high-confidence signals
⚙️ How to Use
- Select your preferred trend method from the dropdown.
- Wait for:
- A breakout in direction (up or down)
- Rising volume and volume spike confirmation
- Follow "Long" (JAC) or "Short" (JAI) labels for potential entries.
🎛️ Configuration
Indicator Leniency - Signal tolerance range after breakout
S&R Length - Pivot detection length for S/R method
Trend Method - Choose how trend is calculated
Volume SMA - Baseline for volume spike detection
Volume Length - Lookback for volume rising check
🧪 Signal Conditions
JAC Direction flips bullish + volume rising + spike
JAI Direction flips bearish + volume rising + spike
⚠️ Limitations
- False signals possible during sideways/choppy markets.
- Volume behavior depends on exchange feed accuracy.
- S/R mode is slower but more stable; EMA & Linear Regression react faster but can whipsaw.
🔧 Advanced Tips
- Use this with Wyckoff Accumulation/Distribution zones for better context.
- Combine with RSI/OBV or higher timeframe trend filters.
- Adjust leniency_lookback if signals feel too early/late.
- If you're using Support and Resistance - Price action moves inside S & R it means that price is ranging.
📝 Notes
- Volume conditions must confirm breakout, not just direction shift.
- Built using native Pine Script switch and plotshape() for clarity.
- "Creek" and "Ice" lines are color-coded trend / Support and Resistance zones.
Açık kaynak kodlu komut dosyası
Gerçek TradingView ruhuna uygun olarak, bu komut dosyasının oluşturucusu bunu açık kaynaklı hale getirmiştir, böylece yatırımcılar betiğin işlevselliğini inceleyip doğrulayabilir. Yazara saygı! Ücretsiz olarak kullanabilirsiniz, ancak kodu yeniden yayınlamanın Site Kurallarımıza tabi olduğunu unutmayın.
Feragatname
Bilgiler ve yayınlar, TradingView tarafından sağlanan veya onaylanan finansal, yatırım, işlem veya diğer türden tavsiye veya tavsiyeler anlamına gelmez ve teşkil etmez. Kullanım Şartları'nda daha fazlasını okuyun.