OPEN-SOURCE SCRIPT
Güncellendi Liquidity Indicator
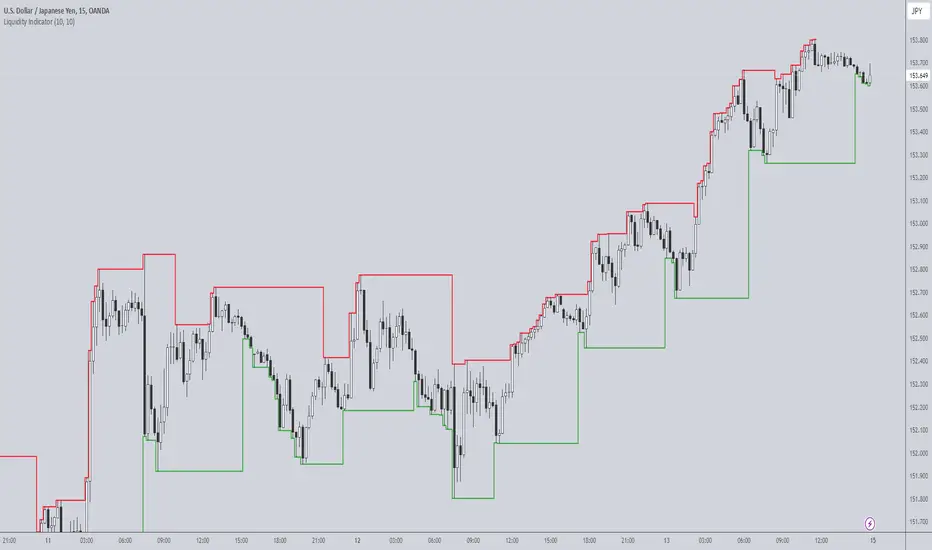
The Liquidity Indicator helps identify key price levels where liquidity may be concentrated by highlighting local highs and local lows on the chart. These levels are calculated using a lookback period to determine the highest and lowest points in the recent price action.
Local Highs: Displayed as red lines, these indicate recent peaks where price has experienced rejection or a possible reversal point.
Local Lows: Displayed as green lines, these represent recent troughs where price may find support or experience a bounce.
This indicator is useful for spotting potential areas of interest for price reversal or continuation, as high liquidity zones may lead to more significant price movements.
Key Features:
Adjustable lookback period to define the scope for identifying local highs and lows.
Continuous plotting without any time restrictions, providing real-time insights into liquidity conditions.
Alerts available for when a local high or local low is detected, enabling timely market analysis.
Use Case:
This indicator can be used in conjunction with other technical analysis tools or strategies to help identify significant price levels where liquidity could impact price action. It is suitable for both intraday and swing traders looking for key price zones where potential reversals or continuations might occur.
Sürüm Notları
The ability to create separate lookback periods for the upper and lower liquidity lines has been added.Sürüm Notları
The ability to create separate lookback periods for the upper and lower liquidity lines has been added.Açık kaynak kodlu komut dosyası
Gerçek TradingView ruhuyla, bu komut dosyasının mimarı, yatırımcıların işlevselliğini inceleyip doğrulayabilmesi için onu açık kaynaklı hale getirdi. Yazarı tebrik ederiz! Ücretsiz olarak kullanabilseniz de, kodu yeniden yayınlamanın Topluluk Kurallarımıza tabi olduğunu unutmayın.
Feragatname
Bilgiler ve yayınlar, TradingView tarafından sağlanan veya onaylanan finansal, yatırım, alım satım veya diğer türden tavsiye veya öneriler anlamına gelmez ve teşkil etmez. Kullanım Koşulları bölümünde daha fazlasını okuyun.
Açık kaynak kodlu komut dosyası
Gerçek TradingView ruhuyla, bu komut dosyasının mimarı, yatırımcıların işlevselliğini inceleyip doğrulayabilmesi için onu açık kaynaklı hale getirdi. Yazarı tebrik ederiz! Ücretsiz olarak kullanabilseniz de, kodu yeniden yayınlamanın Topluluk Kurallarımıza tabi olduğunu unutmayın.
Feragatname
Bilgiler ve yayınlar, TradingView tarafından sağlanan veya onaylanan finansal, yatırım, alım satım veya diğer türden tavsiye veya öneriler anlamına gelmez ve teşkil etmez. Kullanım Koşulları bölümünde daha fazlasını okuyun.