OPEN-SOURCE SCRIPT
Güncellendi ATR Multiples Plotted
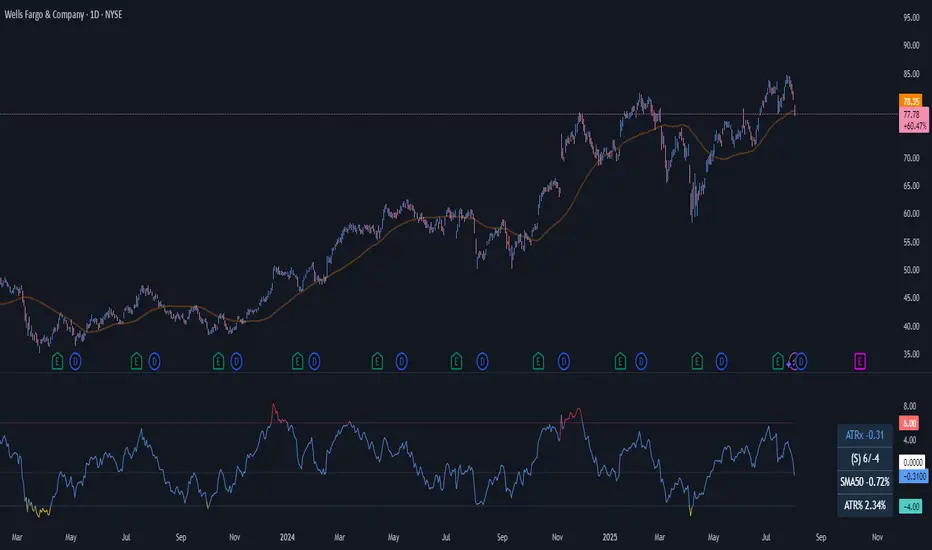
Inspired by @jeffsuntrading and @Fred6724's ATR% multiple from 50-MA.
There are no catch-all values, however a high of 6 and a low of -4 generally has been valuable to me. I tend to look at the historical highs and lows of the indicator, and adjust the Value High and Value Low accordingly to get an idea when profit-taking may be sensible.
The essence is the difference between price and the selected moving average, measured in ATRs.
Sürüm Notları
Added custom ATR LengthSürüm Notları
Added optional 0-lineSürüm Notları
Tidied and clarified some of the code.--Currently working on an 'Adaptive Mode', which will calculate and plot the upper and lower values based on the selected average's historical turning points
Sürüm Notları
Added quick reference table to show the dollar value of your chosen Value High and it's upside percentage. Comes in handy when scanning or evaluating Pre/Post-Market moves. See ATRx6 value and AMZN pre-market value of ~$170 on 02/02/2024 for example.
Sürüm Notları
ChartSürüm Notları
Added option to allow percentage based calculations, which is how Jeff Sun's indicator is calculated. Some changes and clarification to the table, see the tooltips for guidance.
Sürüm Notları
Chart updateSürüm Notları
Fixed typos in tableSürüm Notları
Updated to Pine v6Sürüm Notları
Added Dynamic Mode, which you can enable from the indicator settings. It calculates the upper and lower thresholds based on the lookback value.By default, the lookback is set to 504 bars (roughly 2 years on a daily chart), and it uses the 95th and 5th percentiles. You can change both in the settings. If there’s not enough data to calculate them (like with recent IPOs), it’ll fall back to static values until the full lookback becomes available.
I haven’t nailed down the ideal lookback and percentile settings yet, so the defaults might not be super useful straight away.
Nothing has changed for the static mode. For price-based signals, I find 6 and -4 thresholds work best most of the time. For percentage-based, 9 and -3 seem reliable.
Sürüm Notları
Minor change to info in tableSürüm Notları
Updated chartAçık kaynak kodlu komut dosyası
Gerçek TradingView ruhuyla, bu komut dosyasının mimarı, yatırımcıların işlevselliğini inceleyip doğrulayabilmesi için onu açık kaynaklı hale getirdi. Yazarı tebrik ederiz! Ücretsiz olarak kullanabilseniz de, kodu yeniden yayınlamanın Topluluk Kurallarımıza tabi olduğunu unutmayın.
Feragatname
Bilgiler ve yayınlar, TradingView tarafından sağlanan veya onaylanan finansal, yatırım, alım satım veya diğer türden tavsiye veya öneriler anlamına gelmez ve teşkil etmez. Kullanım Koşulları bölümünde daha fazlasını okuyun.
Açık kaynak kodlu komut dosyası
Gerçek TradingView ruhuyla, bu komut dosyasının mimarı, yatırımcıların işlevselliğini inceleyip doğrulayabilmesi için onu açık kaynaklı hale getirdi. Yazarı tebrik ederiz! Ücretsiz olarak kullanabilseniz de, kodu yeniden yayınlamanın Topluluk Kurallarımıza tabi olduğunu unutmayın.
Feragatname
Bilgiler ve yayınlar, TradingView tarafından sağlanan veya onaylanan finansal, yatırım, alım satım veya diğer türden tavsiye veya öneriler anlamına gelmez ve teşkil etmez. Kullanım Koşulları bölümünde daha fazlasını okuyun.