PROTECTED SOURCE SCRIPT
Güncellendi Global Liquidity Shifted
Overview
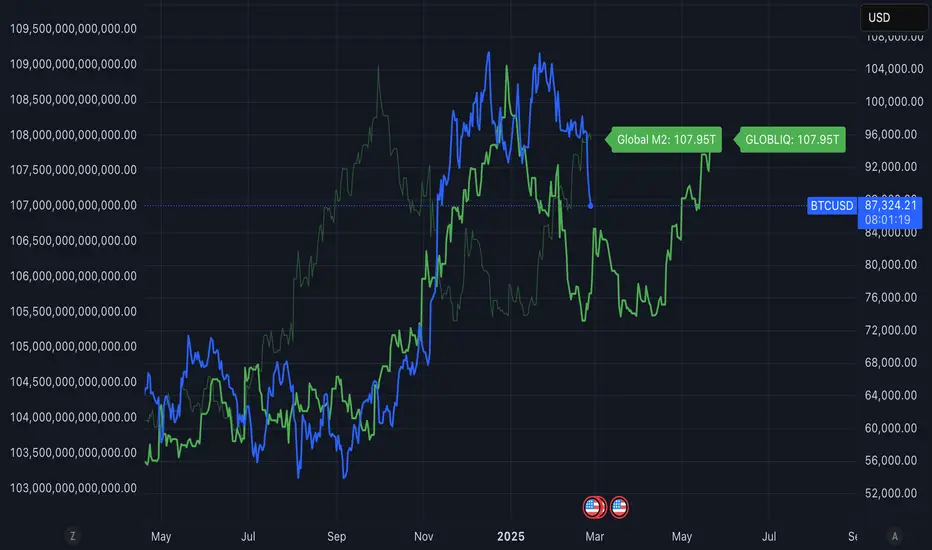
This indicator tracks global liquidity by aggregating M2 money supply data from major economies around the world, denominated in US dollars. It allows users to shift the data forward or backward in time to analyze correlations with other assets, particularly Bitcoin.
Features
Background
Based on research by Lyn Alden and Sam Callahan (September 2024), which found that Bitcoin moves in the direction of global liquidity 83% of the time in any given 12-month period - a higher correlation than any other major asset class. This makes Bitcoin an excellent "global liquidity barometer."
How to Use
Included Economies
This indicator aggregates M2 data from:
## Interpretation
Rising global liquidity typically supports risk assets, particularly Bitcoin. When liquidity contracts, risk assets often face headwinds. By shifting the liquidity data, you can identify lead/lag relationships between liquidity conditions and asset prices.
Notes
References
Based on research published at: https://www.lynalden.com/bitcoin-a-global-liquidity-barometer/
This indicator tracks global liquidity by aggregating M2 money supply data from major economies around the world, denominated in US dollars. It allows users to shift the data forward or backward in time to analyze correlations with other assets, particularly Bitcoin.
Features
- Comprehensive global liquidity measurement combining M2 data from 21 major economies
- Adjustable time shift parameter (0-24 months) to align liquidity data with price movements
- Clean visualization with customizable labels
Background
Based on research by Lyn Alden and Sam Callahan (September 2024), which found that Bitcoin moves in the direction of global liquidity 83% of the time in any given 12-month period - a higher correlation than any other major asset class. This makes Bitcoin an excellent "global liquidity barometer."
How to Use
- Add the indicator to your chart
- Adjust the "Forward Shift (Months)" parameter to align global liquidity with asset price movements
- Compare the shifted liquidity line with Bitcoin or other asset prices to identify correlations and potential divergences
Included Economies
This indicator aggregates M2 data from:
- North America: US, Canada
- Eurozone
- Non-EU Europe: Switzerland, UK, Finland, Russia
- Asia: China, Taiwan, Hong Kong, India, Japan, Philippines, Singapore
- Latin America: Brazil, Colombia, Mexico
- Middle East: UAE, Turkey
- Africa: South Africa
- Pacific: New Zealand
## Interpretation
Rising global liquidity typically supports risk assets, particularly Bitcoin. When liquidity contracts, risk assets often face headwinds. By shifting the liquidity data, you can identify lead/lag relationships between liquidity conditions and asset prices.
Notes
- All M2 data is converted to USD to account for both money supply changes and relative currency strength
- The indicator serves as a macro framework for understanding liquidity-driven market cycles
References
Based on research published at: https://www.lynalden.com/bitcoin-a-global-liquidity-barometer/
Sürüm Notları
• Fixed the forward shifting mechanism to properly shift the entire Global Liquidity plot without truncating historical data• Maintained full historical Global Liquidity data when applying shifts
• Improved label positioning to match the shifted data
This update makes the indicator more focused and reliable for analyzing potential future correlations between Global Liquidity and asset prices.
Usage tip: Set your desired forward shift (0-24 months) to visualize how current price action aligns with future Global Liquidity trends.
Sürüm Notları
Version Update: 1.1This update improves the Global Liquidity Shifted indicator with:
- Decimal Month Shifting: You can now enter decimal values (like 3.3) for the "Forward Shift (Months)" setting, allowing for more precise alignment with market cycles.
- Timeframe Usage Warning: Added a warning message when using the indicator on intraday charts, as the indicator is designed for Daily and higher timeframes where economic data is more meaningful.
Korumalı komut dosyası
Bu komut dosyası kapalı kaynak olarak yayınlanmaktadır. Ancak, ücretsiz ve herhangi bir sınırlama olmaksızın kullanabilirsiniz – daha fazla bilgiyi buradan edinebilirsiniz.
Feragatname
Bilgiler ve yayınlar, TradingView tarafından sağlanan veya onaylanan finansal, yatırım, alım satım veya diğer türden tavsiye veya öneriler anlamına gelmez ve teşkil etmez. Kullanım Koşulları bölümünde daha fazlasını okuyun.