OPEN-SOURCE SCRIPT
M2 Growth Rate vs Borrowing Rate
Have you ever wondered how fast M2 is actually growing? Have you ever wanted to compare its percentage growth rate to the actual cost of borrowing? Are you also, like me, a giant nerd with too much time on your hands?
M2 Growth Rate vs Borrowing Rate
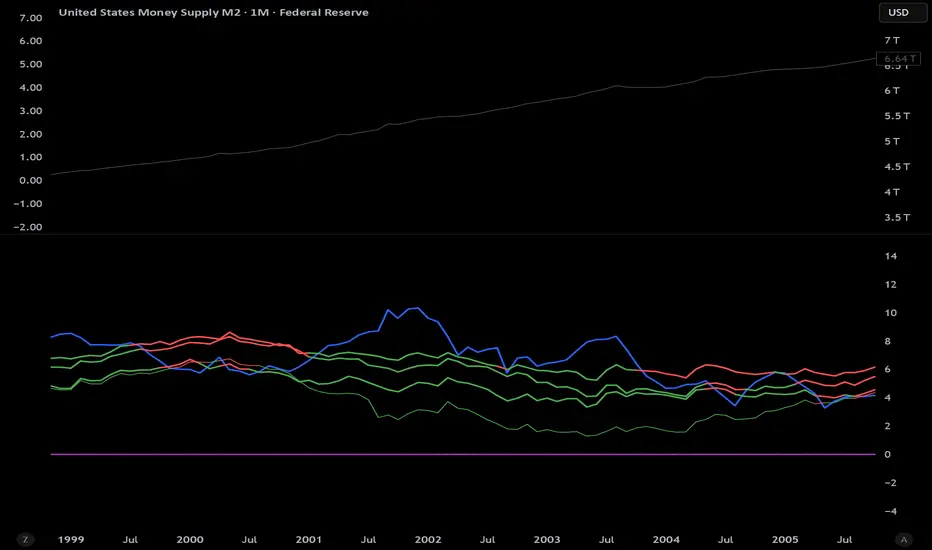
This Pine Script indicator analyzes the annualized growth rate of M2 money supply and compares it to key borrowing rates, providing insights into the relationship between money supply expansion and borrowing costs. Users can select between US M2 or a combined M2 (aggregating US, EU, China, Japan, and UK money supplies, adjusted for currency exchange rates). The M2 growth period is customizable, offering options from 1 month to 5 years for flexible analysis over different time horizons. The indicator fetches monthly data for US M2, EU M2, China M2, Japan M2, UK M2, and exchange rates (EURUSD, CNYUSD, JPYUSD, GBPUSD) to compute the combined M2 in USD terms.
It plots the annualized M2 growth rate alongside borrowing rates, including US 2-year and 10-year Treasury yields, corporate bond effective yield, high-yield bond effective yield, and 30-year US mortgage rates. Borrowing rates are color-coded for clarity: red if the rate exceeds the selected M2 growth rate, and green if below, highlighting relative dynamics. Displayed on a separate pane with a zero line for reference, the indicator includes labeled plots for easy identification.
This tool is designed for informational purposes, offering a visual framework to explore economic trends without providing trading signals or financial advice.
M2 Growth Rate vs Borrowing Rate
This Pine Script indicator analyzes the annualized growth rate of M2 money supply and compares it to key borrowing rates, providing insights into the relationship between money supply expansion and borrowing costs. Users can select between US M2 or a combined M2 (aggregating US, EU, China, Japan, and UK money supplies, adjusted for currency exchange rates). The M2 growth period is customizable, offering options from 1 month to 5 years for flexible analysis over different time horizons. The indicator fetches monthly data for US M2, EU M2, China M2, Japan M2, UK M2, and exchange rates (EURUSD, CNYUSD, JPYUSD, GBPUSD) to compute the combined M2 in USD terms.
It plots the annualized M2 growth rate alongside borrowing rates, including US 2-year and 10-year Treasury yields, corporate bond effective yield, high-yield bond effective yield, and 30-year US mortgage rates. Borrowing rates are color-coded for clarity: red if the rate exceeds the selected M2 growth rate, and green if below, highlighting relative dynamics. Displayed on a separate pane with a zero line for reference, the indicator includes labeled plots for easy identification.
This tool is designed for informational purposes, offering a visual framework to explore economic trends without providing trading signals or financial advice.
Açık kaynak kodlu komut dosyası
Gerçek TradingView ruhuyla, bu komut dosyasının mimarı, yatırımcıların işlevselliğini inceleyip doğrulayabilmesi için onu açık kaynaklı hale getirdi. Yazarı tebrik ederiz! Ücretsiz olarak kullanabilseniz de, kodu yeniden yayınlamanın Topluluk Kurallarımıza tabi olduğunu unutmayın.
Feragatname
Bilgiler ve yayınlar, TradingView tarafından sağlanan veya onaylanan finansal, yatırım, alım satım veya diğer türden tavsiye veya öneriler anlamına gelmez ve teşkil etmez. Kullanım Koşulları bölümünde daha fazlasını okuyun.