OPEN-SOURCE SCRIPT
Momentum Memory Indicator

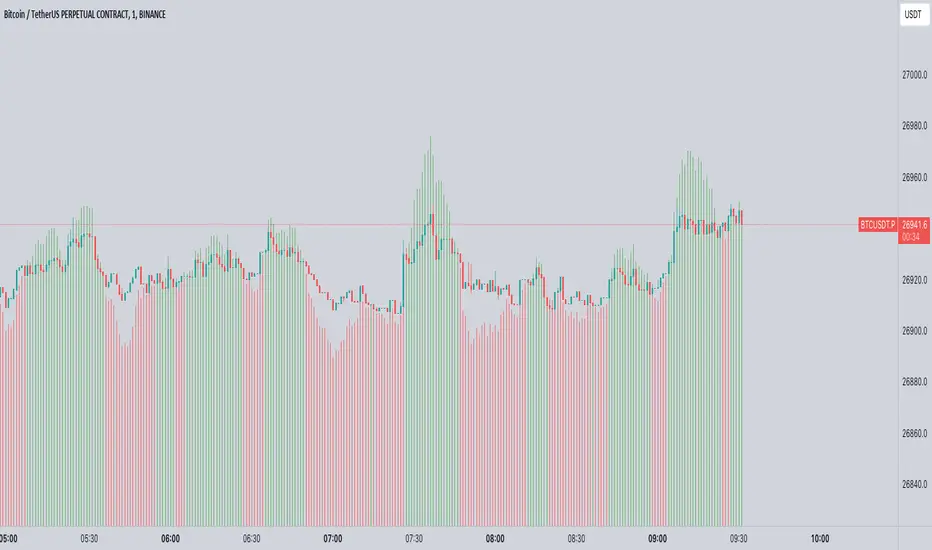
The Momentum Memory Indicator (MMI) is a custom tool designed to predict future price movements based on the historical momentum of an asset. By calculating the Rate of Change (ROC) and then averaging it over a specified "memory" period, the MMI provides a prediction that reflects both recent and slightly older momentum data. The prediction is visualized as a histogram, with colors indicating the direction of the momentum.
**Parameters:**
1. **Rate of Change Period (ROC Period):** This parameter sets the period for the Rate of Change calculation, which measures the momentum of the asset. The default value is 14.
2. **Memory Period:** This parameter determines the period over which the average momentum is calculated. By considering momentum over this "memory" period, the indicator aims to provide a more stable and reliable prediction. The default value is 5.
**Logic:**
1. **Rate of Change (Momentum):** The ROC is calculated based on the asset's closing prices over the specified ROC period. It provides a measure of how much the price has changed over that period, indicating momentum.
2. **Average Momentum:** The average momentum is calculated by taking a simple moving average (SMA) of the ROC values over the memory period. This smoothens out the momentum data and provides a more stable value for prediction.
3. **Prediction:** The prediction is calculated by adjusting the current closing price based on the average momentum. This gives an estimate of where the price might be in the next period, assuming the momentum continues.
4. **Prediction Color:** The color of the prediction histogram is determined by the direction of the average momentum. A positive momentum results in a green histogram, while a negative momentum results in a red histogram.
**Plots:**
1. **Prediction (Histogram):** Represents the predicted price movement based on the average momentum. The direction and magnitude of the histogram bars provide insights into the expected price change. The color of the bars (green or red) indicates the direction of the momentum.
Açık kaynak kodlu komut dosyası
Gerçek TradingView ruhuyla, bu komut dosyasının mimarı, yatırımcıların işlevselliğini inceleyip doğrulayabilmesi için onu açık kaynaklı hale getirdi. Yazarı tebrik ederiz! Ücretsiz olarak kullanabilseniz de, kodu yeniden yayınlamanın Topluluk Kurallarımıza tabi olduğunu unutmayın.
Feragatname
Bilgiler ve yayınlar, TradingView tarafından sağlanan veya onaylanan finansal, yatırım, alım satım veya diğer türden tavsiye veya öneriler anlamına gelmez ve teşkil etmez. Kullanım Koşulları bölümünde daha fazlasını okuyun.