OPEN-SOURCE SCRIPT
Güncellendi DMA Buy & Sell Signal with Alerts
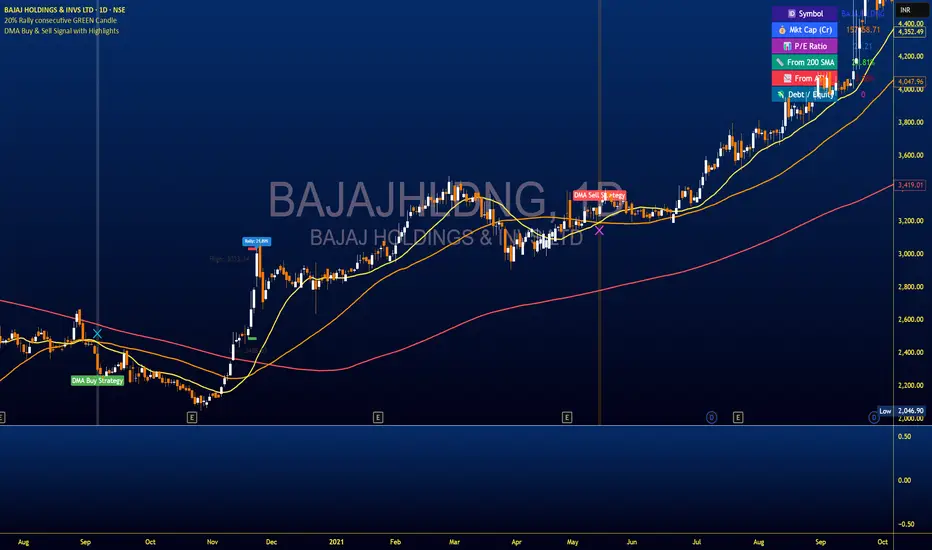
This script identifies **BUY** signals when the 20 DMA crosses **below** the 50 DMA, with the alignment: `200 DMA > 50 DMA > 20 DMA > Price`.
It also plots **SELL** signals when the 20 DMA crosses **above** the 50 DMA, with the alignment: `Price > 20 DMA > 50 DMA > 200 DMA`.
Each signal is plotted on the chart with green "BUY" and red "SELL" labels.
The script includes alert conditions for both signals.
It uses simple moving averages (SMA) of 20, 50, and 200 periods.
Sürüm Notları
This script identifies **BUY** signals when the 20 DMA crosses **below** the 50 DMA, with the alignment: `200 DMA > 50 DMA > 20 DMA > Price`.It also plots **SELL** signals when the 20 DMA crosses **above** the 50 DMA, with the alignment: `Price > 20 DMA > 50 DMA > 200 DMA`.
Each signal is plotted on the chart with green "BUY" and red "SELL" labels.
The script includes alert conditions for both signals.
It uses simple moving averages (SMA) of 20, 50, and 200 periods.
Açık kaynak kodlu komut dosyası
Gerçek TradingView ruhuna uygun olarak, bu komut dosyasının oluşturucusu bunu açık kaynaklı hale getirmiştir, böylece yatırımcılar betiğin işlevselliğini inceleyip doğrulayabilir. Yazara saygı! Ücretsiz olarak kullanabilirsiniz, ancak kodu yeniden yayınlamanın Site Kurallarımıza tabi olduğunu unutmayın.
Feragatname
Bilgiler ve yayınlar, TradingView tarafından sağlanan veya onaylanan finansal, yatırım, işlem veya diğer türden tavsiye veya tavsiyeler anlamına gelmez ve teşkil etmez. Kullanım Şartları'nda daha fazlasını okuyun.