OPEN-SOURCE SCRIPT
Güncellendi BankNifty targets using VIX Version 2
Original Idea Credit: Verified Market Waves
Hi,
After watching different videos online on how to get targets of BankNifty & Nifty decided to write this small script using VIX.
Nothing great but I really like the concept of getting high and low targets for the day or weekly or monthly or yearly.
What does the script do
1. We get closing of India Vix & BankNifty and Nifty
2. We get square root of Daily (365 days) | Weekly (52) | Monthly (12) & Yearly (1)
3. We divide India Vix closing with different square root to get a decimal value.
4. We use the derived value from step 3 which is used as % to calculate high and low values on BankNifty close price.
Small explanation via below screen shot to understand how to use it.

As always it comes with source code so you can modify as per your requirement.
Hope it helps 👍
Hi,
After watching different videos online on how to get targets of BankNifty & Nifty decided to write this small script using VIX.
Nothing great but I really like the concept of getting high and low targets for the day or weekly or monthly or yearly.
What does the script do
1. We get closing of India Vix & BankNifty and Nifty
2. We get square root of Daily (365 days) | Weekly (52) | Monthly (12) & Yearly (1)
3. We divide India Vix closing with different square root to get a decimal value.
4. We use the derived value from step 3 which is used as % to calculate high and low values on BankNifty close price.
Small explanation via below screen shot to understand how to use it.
As always it comes with source code so you can modify as per your requirement.
Hope it helps 👍
Sürüm Notları
█ What's New Earlier it was just showing Vix High Price or Low Price hit as per previous Day calculations. Since Day High will always be higher than Vix High Price, we now come to know the difference i.e. How much high it went from our calculated Vix High and its percentage (%). Similarly for the Low target hit.
Yellow Box:
- Now it will show you Yellow Box in middle of your chart Time Frame is not Day Time Frame.
- It will show you Yellow Box] in middle of your selected script is not BankNifty Spot.
Hope it helps.
Trade nicely & earn nicely.
Sürüm Notları
Updates includes:- You can now change table display to Bottom Right of your screen or Top Right.
- You can disable all plotting VIX, Previous Day VIX High, Previous Day VIX Low, Calculated VIX High for the Day and Calculated VIX Low for the Day.
Added displaying of VIX and VIX Difference along with its percentage (%) difference. If VIX is greater than Previous Day VIX it will show us “⬆” an uparrow and if it is Lower than Previous Day VIX it will show us “⬇” down arrow. Once we know when VIX was up or down decided to add different color so it’s easier to spot things while analysing it for study. So when VIX is down we show it in different color.
Cheers.
Sürüm Notları
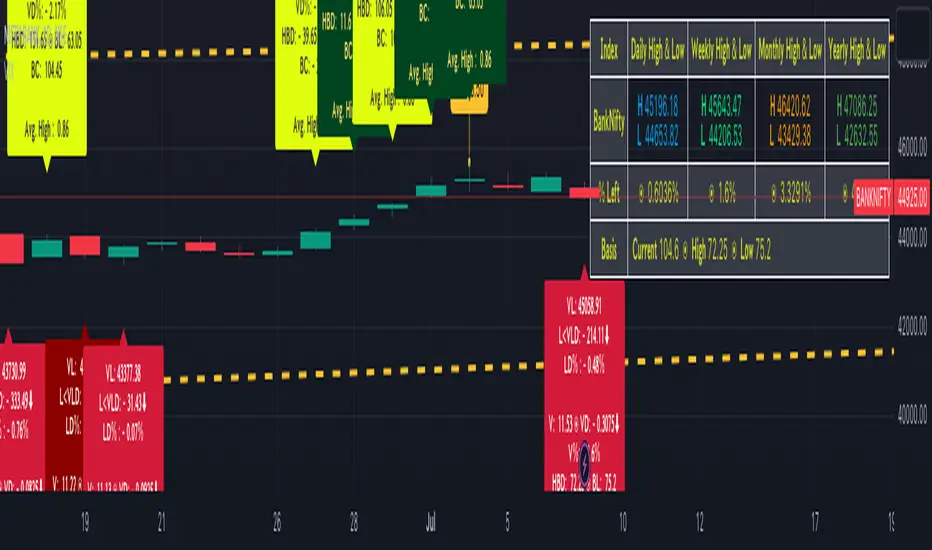
🎲 OptionsYou can now enable and disable Table showing Daily / Weekly / Monthly / Yearly High & Low.
You can Select Font Size options available are
- Auto
- Huge
- Large
- Normal
- Small
- Tiny
Default is Normal
🎲 Fonts : You can select Different Fonts options available are:
* Sans
* Sans Italic
* Sans Bold
* Sans Bold Italic
* Sans-Serif
* Sans-Serif Italic
* Sans-Serif Bold,
* Sans-Serif Bold Italic
* Fraktur
* Fraktur Bold
* Script
* Script Bold
* Double-Struck
* Monospace
* Regional Indicator
* Small
* Full Width
* Circled
* Default
Default is Sans Bold
Alerts: You’ll get alerts once the Current Market Price (CMP) goes above Previous Day High & when CMP goes below Previous Day High.
❗️NOTE : Alerts are set with Frequency all meaning every time the CMP goes above or below our condition you’ll keep getting Alerts on your screen.
At times it will be disabled automatically, so you have to enable it manually. Just keep this in mind.
That’s all in it.
Sürüm Notları
🎲 Basis : Here basis means Difference between Bank Nifty Future Price — Bank Nifty Spot Price.
Now it will show High Basis Difference and close basis difference.
Now inside Table it will show (%) Percentage which means how much % Percentage still left for High and Low to reach. Valid only for Bank Nifty
Alerts: Inside alerts message added string to display date and time when VIX High or VIX Low is triggered.
Sürüm Notları
Basis: Incorporated Basis in Live Trading Hours. Removed all trial error codes for grabbing Time when VIX High or VIX Low triggered. Once successful will release it.
That's all in it.
Sürüm Notları
Tried to remove all the clutter in display. Nifty information is now optional. If you need to see Nifty VIX High and Low for Daily, Weekly, Monthly and Yearly go to settings and Unable Show Nifty Vix. Labels displayed on Bar Index now uses abbreviation explained below.
Abbreviation:
𝗩𝗛 = VIX High
𝗛 > 𝗩𝗛𝗗 = High is greater than VIX High Difference meaning how many points higher it went above VIX High
𝗛𝗗% = High Difference in % (Percentage)
𝗩 = VIX Current INDIA VIX
𝗩𝗗 = VIX Difference in points
𝗩𝗗% = VIX Difference in % (Percentage)
𝗛𝗕𝗗 = High Basis Difference i.e. When High was being Made in Spot the Future price difference is shown
𝗕𝗟 = Basis Low i.e. When Low was made Basis difference is shown
𝗕𝗖 = Basis Close
𝗩𝗟 = VIX Low
𝗟 < 𝗩𝗟𝗗 = Low is less then VIX Low meaning how many points lower it went below VIX Low
𝗟𝗗% = Low Difference in % (Percentage)
If you hover your mouse near Basis text you’ll find the abbreviation as ToolTip.
𝗧𝗵𝗮𝘁𝘀 𝗮𝗹𝗹 𝗶𝗻 𝗶𝘁. 𝗖𝗵𝗲𝗲𝗿𝘀 !
Sürüm Notları
Now you have an option to see VIX data inside ToolTip and your screen will look like below.That's all in it.
Sürüm Notları
Averages: Now we are able to see average percentage (%) of VIX HIGH percent and VIX LOW percent. The data which we get for VIX HIGH and VIX LOW for this starts from the year 2010 till date. Below screen shot for your reference when i was debugging the average data. So if we see that Bank Nifty is going above or below the average percent of VIX HIGH or VIX LOW we can take our shot accordingly.
Hope it helps.
That’s all in it. Cheers
Sürüm Notları
Colour Shades: Added 2 new colour shades. Blue when Bank Nifty goes above the average % price and Pink colour when it goes below average % price. As IndiaVIX keep going higher we will see that Bank Nifty crosses average price. That's all in it.
Sürüm Notları
Logs: We can now log all data using recently added new function in PineScripting called as log(). So we are using this features to log all the data from the year 2010 till date. Log will show us date, High Reached or Low Reached, VIX information on that particular date & percentage (%) it went high or below the VIX calculated price all relevant data for study. Below image for reference.Note: As mentioned in Pine Script documentation.
Scripts using logs must be personal scripts; privately or publicly published scripts cannot generate logs, even if they contain calls to log.*() functions.
How you would use this is log feature ? For that you need to save the source code in your pine editor, next save it giving some suitable name of your choice for the file name, then load the indicator to your chart by clicking Add to Chart and finally click of the three dots menu to select Pine Logs to see the logs. Below image for your reference.
If you are able to see logs Hurray !!
That’s all in it.
Sürüm Notları
Typo error rectified. Açık kaynak kodlu komut dosyası
Gerçek TradingView ruhuna uygun olarak, bu komut dosyasının oluşturucusu bunu açık kaynaklı hale getirmiştir, böylece yatırımcılar betiğin işlevselliğini inceleyip doğrulayabilir. Yazara saygı! Ücretsiz olarak kullanabilirsiniz, ancak kodu yeniden yayınlamanın Site Kurallarımıza tabi olduğunu unutmayın.
Feragatname
Bilgiler ve yayınlar, TradingView tarafından sağlanan veya onaylanan finansal, yatırım, işlem veya diğer türden tavsiye veya tavsiyeler anlamına gelmez ve teşkil etmez. Kullanım Şartları'nda daha fazlasını okuyun.
Açık kaynak kodlu komut dosyası
Gerçek TradingView ruhuna uygun olarak, bu komut dosyasının oluşturucusu bunu açık kaynaklı hale getirmiştir, böylece yatırımcılar betiğin işlevselliğini inceleyip doğrulayabilir. Yazara saygı! Ücretsiz olarak kullanabilirsiniz, ancak kodu yeniden yayınlamanın Site Kurallarımıza tabi olduğunu unutmayın.
Feragatname
Bilgiler ve yayınlar, TradingView tarafından sağlanan veya onaylanan finansal, yatırım, işlem veya diğer türden tavsiye veya tavsiyeler anlamına gelmez ve teşkil etmez. Kullanım Şartları'nda daha fazlasını okuyun.