OPEN-SOURCE SCRIPT
AI+ Scalper [BigMoneyMazz Enhanced]
Overview:
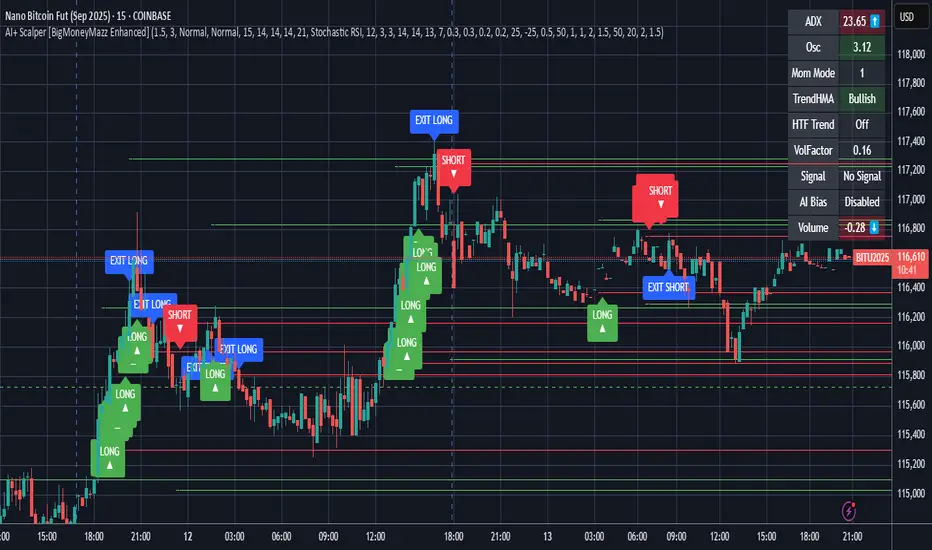
A professional-grade multi-factor trading indicator that combines trend, momentum, volatility, and volume analysis into a single composite oscillator. It provides clear visual buy/sell signals on your chart with automatic stop-loss and take-profit levels.
How It Works:
4-Way Market Analysis: Analyzes trend strength (ADX), momentum (your choice of 3 oscillators), volatility (ATR), and volume (OBV)
Smart Signal Generation: Only generates signals when multiple factors align (price above/below dynamic thresholds, trend confirmation, and sufficient volatility)
Visual Trading Plan: Plots clear LONG/SHORT labels on your chart with dashed lines showing exact stop-loss (red) and take-profit (green) levels
Live Dashboard: Real-time monitoring of all market conditions in a handy table
Key Features:
🎯 Clear Chart Signals: Green "LONG" and red "SHORT" labels with arrows
⚡ Risk Management: Automatic ATR-based stop-loss and take-profit levels
📊 Smart Dashboard: All key metrics in one view (ADX, Oscillator, Trend, Volume)
🔒 Non-Repainting: Uses only confirmed closing prices for reliable signals
⚙️ Fully Customizable: Adjust every aspect to your trading style
Recommended Settings for Day Trading:
Timeframe: 5-15 minutes
ATR Multiplier SL: 1.5 (tight stop)
ATR Multiplier TP: 3.0 (2:1 risk-reward)
Momentum Mode: Stochastic RSI (most responsive)
Use HTF Filter: ON (15-minute timeframe)
Latching Mode: ON (avoids whipsaws)
Recommended Settings for Swing Trading:
Timeframe: 1H-4H
ATR Multiplier SL: 2.0
ATR Multiplier TP: 4.0 (2:1 risk-reward)
Momentum Mode: Fisher RSI (smoother)
Use HTF Filter: ON (4H or Daily timeframe)
Latching Mode: ON
How to Use:
Wait for LONG/SHORT labels to appear on your chart
Enter trade when price touches your preferred entry level
Set stop-loss at the red dashed line
Set take-profit at the green dashed line
Use the dashboard to confirm market conditions (ADX > 25 = strong trend)
Signal Interpretation:
LONG ▲: Strong buy signal - trend bullish, oscillator above upper threshold
SHORT ▼: Strong sell signal - trend bearish, oscillator below lower threshold
EXIT: Close position (SL/TP hit)
Pro Tip: The dashboard is your best friend! Check that ADX is above 25 (strong trend) and volume is confirming before entering any trade.
This indicator works best as a confirmation tool alongside your existing strategy rather than a completely automated system. Always practice proper risk management!
Açık kaynak kodlu komut dosyası
Gerçek TradingView ruhuna uygun olarak, bu komut dosyasının oluşturucusu bunu açık kaynaklı hale getirmiştir, böylece yatırımcılar betiğin işlevselliğini inceleyip doğrulayabilir. Yazara saygı! Ücretsiz olarak kullanabilirsiniz, ancak kodu yeniden yayınlamanın Site Kurallarımıza tabi olduğunu unutmayın.
Feragatname
Bilgiler ve yayınlar, TradingView tarafından sağlanan veya onaylanan finansal, yatırım, işlem veya diğer türden tavsiye veya tavsiyeler anlamına gelmez ve teşkil etmez. Kullanım Şartları'nda daha fazlasını okuyun.