OPEN-SOURCE SCRIPT
Price-EMA Z-Score Background
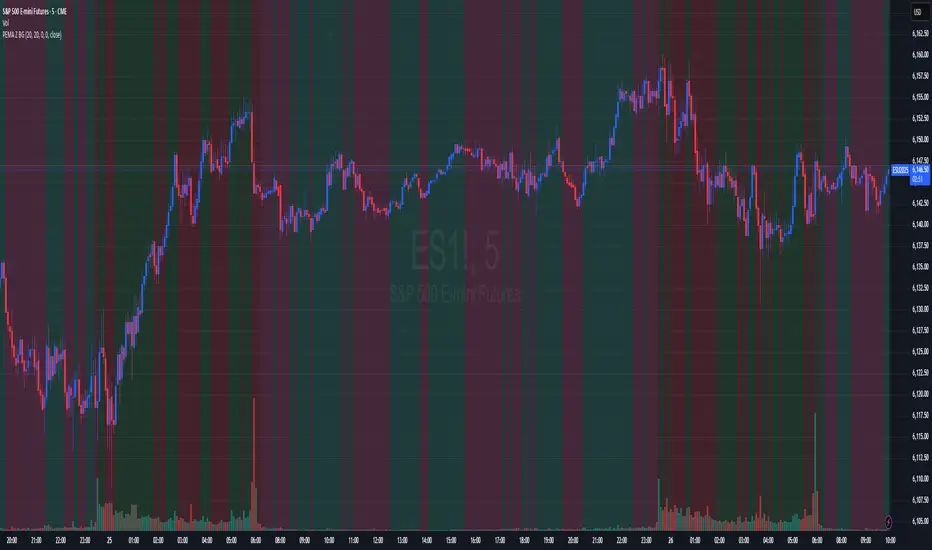
he “Price‑to‑EMA Z‑Score Background” indicator is designed to give you a clear, visual sense of when price has moved unusually far away from its smoothed trend, and to highlight those moments as potential overextension or mean‑reversion opportunities. Under the hood, it first computes a standard exponential moving average (EMA) of your chosen lookback length, then measures the raw difference between the current close and that EMA on every bar. To make that raw deviation comparable across different markets and timeframes, it converts the series of differences into a z‑score—subtracting the rolling mean of the deviations and dividing by their rolling standard deviation over a second lookback window.
Once you’ve normalized price‑to‑EMA distance into z‑score units, you can set two simple trigger levels: one upper threshold and one lower threshold. Whenever the z‑score climbs above the upper threshold, the chart background glows green, signaling that price is extended far above its EMA (and might be ripe for a pullback). Whenever the z‑score falls below the lower threshold, the background turns red, calling out an equally extreme move below the EMA (and a possible oversold bounce). Between those bands, no shading appears, letting you know price is trading within its “normal” range around the trend.
By adjusting the EMA period, the z‑score lookback, and the two trigger levels, you can dial in early warning signals (e.g. ±1 σ) or wait for very stretched moves (±2 σ or more). Used in concert with your favorite momentum or pattern tools—or even as a standalone visual cue—this simple background‑shading approach makes it easy to spot when a market is running too hot or too cold relative to its own recent average.
Açık kaynak kodlu komut dosyası
Gerçek TradingView ruhuyla, bu komut dosyasının mimarı, yatırımcıların işlevselliğini inceleyip doğrulayabilmesi için onu açık kaynaklı hale getirdi. Yazarı tebrik ederiz! Ücretsiz olarak kullanabilseniz de, kodu yeniden yayınlamanın Topluluk Kurallarımıza tabi olduğunu unutmayın.
Feragatname
Bilgiler ve yayınlar, TradingView tarafından sağlanan veya onaylanan finansal, yatırım, alım satım veya diğer türden tavsiye veya öneriler anlamına gelmez ve teşkil etmez. Kullanım Koşulları bölümünde daha fazlasını okuyun.