PROTECTED SOURCE SCRIPT
Güncellendi 4H-50/50 Method
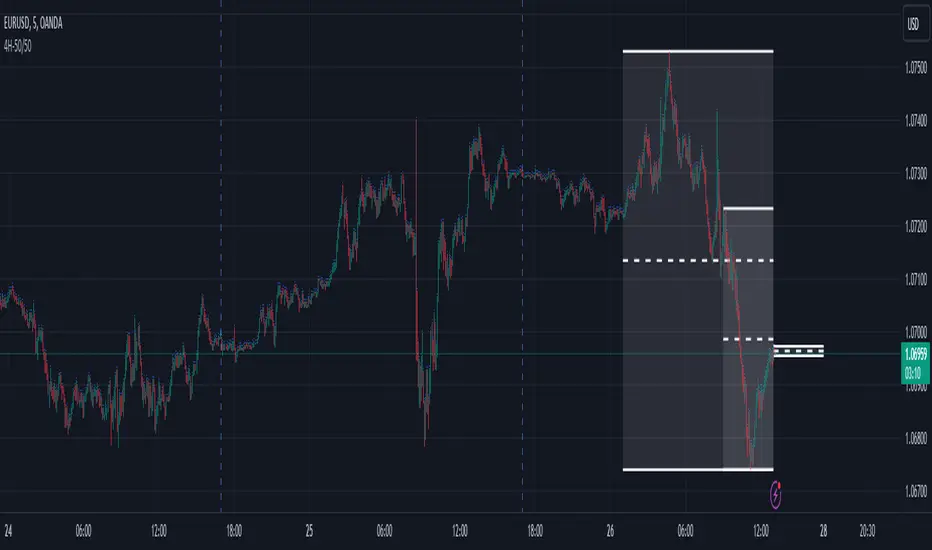
4H-50/50 tool is a way to visualize top down analysis.
• There are three boxes illustrated on the chart
- One box shows the past 4 hour time frame's high, low and center
- One box shows the past 12 hour time frame's high, low and center
- The last box is the current 4 hour time frame's high, low and center
• Four hour blocks start on specific hours 1, 5, 9, 13, 17 & 21
• The 50% marks can act as resistance/support
• The 50% marks can also show trend
- If the instrument is trading below all 50% lines, this is one indication that price will remain low or go lower.
- If the instrument is trading above all 50% lines, this is one indication that price will remain high or go higher
• The indicator can also show sentiment values, which can be found on several outside websites
- After entering both the long and short sentiment, a 10 pip bumper will appear around these sentiment numbers giving another form of support/resistance to watch for
Current limitations:
• The four hour blocks currently only work on the 5 minute candle timeframe
• The sentiment bumper size and color are fixed
Bugs?
Kindly report any issues you run into and I'll try to fix them promptly.
Thank you!
Sürüm Notları
4H-50/50 tool is a way to visualize top down analysis.• There are three boxes illustrated on the chart
- One box shows the past 4 hour time frame's high, low and center
- One box shows the past 12 hour time frame's high, low and center
- The last box is the current 4 hour time frame's high, low and center
• Four hour blocks start on specific hours 1, 5, 9, 13, 17 & 21
• The 50% marks can act as resistance/support
• The 50% marks can also show trend
- If the instrument is trading below all 50% lines, this is one indication that price will remain low or go lower.
- If the instrument is trading above all 50% lines, this is one indication that price will remain high or go higher
• The indicator can also show sentiment values, which can be found on several outside websites
- After entering both the long and short sentiment, a 10 pip bumper will appear around these sentiment numbers giving another form of support/resistance to watch for
Current limitations:
• The four hour blocks currently only work on the 5 minute candle timeframe
• The sentiment bumper size and color are fixed
Bugs?
Kindly report any issues you run into and I'll try to fix them promptly.
Thank you!
Korumalı komut dosyası
Bu komut dosyası kapalı kaynak olarak yayınlanmaktadır. Ancak, ücretsiz ve herhangi bir sınırlama olmaksızın kullanabilirsiniz – daha fazla bilgiyi buradan edinebilirsiniz.
Feragatname
Bilgiler ve yayınlar, TradingView tarafından sağlanan veya onaylanan finansal, yatırım, alım satım veya diğer türden tavsiye veya öneriler anlamına gelmez ve teşkil etmez. Kullanım Koşulları bölümünde daha fazlasını okuyun.