OPEN-SOURCE SCRIPT
Güncellendi Consolidation Box
1. Overview & Purpose
The "Faithful Box" is a powerful TradingView indicator designed to automatically identify and visualize high-quality price consolidation zones, often known as 'trading ranges' or 'boxes'.
This tool is a direct Pine Script translation of a specific, robust Python-based analysis strategy. Its primary goal is not just to find any sideways movement, but to qualify it based on a strict set of rules, ensuring that only meaningful and tradable consolidation patterns are highlighted on the chart.
2. Core Logic: How It Works
The indicator's intelligence is based on several key rules translated from the original Python script:
Box Definition (Based on Closing Prices): The most crucial rule is how the box is defined. Unlike many tools that use candle wicks (highs and lows), this indicator establishes the Ceiling (Resistance) and the Floor (Support) of the box using the highest Close price and the lowest Close price over the specified analysis period. This provides a more stable and representative view of the true consolidation zone, ignoring outlier price spikes.
Quality Filters: A consolidation is only considered valid and drawn on the chart if it meets two strict criteria:
Minimum Touches: The price must "test" the ceiling and floor a minimum number of times. A "touch" is counted with a tolerance — the High of a candle only needs to get close to the ceiling, and the Low close to the floor. This simulates how price interacts with support and resistance zones in the real world.
Maximum Height: The consolidation range cannot be excessively wide or volatile. The box will only be drawn if its total height, as a percentage of its price, is below a user-defined limit.
3. Visual Features on the Chart
When a valid consolidation pattern is detected, the indicator draws a semi-transparent box over the analysis period. The most powerful visual feature is its dynamic coloring, which functions as a built-in alert system:
🟥 Red Box: The box turns red when the price enters the upper "Action Zone" (e.g., the top 30% of the range). This visually signals that the price is near a key resistance level, alerting the trader to a potential reversal or breakout opportunity.
🟩 Green Box: The box turns green when the price enters the lower "Action Zone" (e.g., the bottom 30% of the range). This highlights that the price is testing a key support level.
⬜ Gray Box: The box remains a neutral gray when the price is trading in the middle of the range, which can often be considered a "no-trade" or "wait-and-see" zone.
4. Configuration (Indicator Inputs)
You have full control over the indicator's sensitivity through its inputs:
Analysis Period (days): Defines the lookback window (in trading days) to search for a consolidation pattern. Common values are 42 (approx. 2 months) or 63 (approx. 3 months).
Maximum Box Height (%): Filters out consolidations that are too volatile or wide. A lower percentage will find tighter, more compressed consolidations.
Minimum Ceiling/Floor Touches: Defines the "strength" of the support and resistance levels. Requiring more touches will result in fewer detected patterns, but likely of higher quality.
Touch Tolerance (%): Defines how close the High/Low needs to get to the edge of the box to be counted as a touch. A value of 2% means a touch is registered if the price comes within 2% of the box's total height from the edge.
Action Zone (%): Customizes the size of the red (resistance) and green (support) zones. A value of 30% means the top 30% of the box will be the red zone, and the bottom 30% will be the green zone.
Sürüm Notları
Consolidation Box with Action Zones & Screener1. Overview
This indicator is designed to automatically identify, draw, and analyze periods of price consolidation, also known as sideways markets or trading ranges. It helps traders visualize key support and resistance levels, identify potential reversal zones, and, most importantly, scan the entire market for assets currently in a consolidation phase using the TradingView Screener.
The core idea is to frame the price action within a "box" and provide visual cues about where the price is trading within that range, highlighting potential areas of interest for both long and short opportunities.
2. Key Features
Automatic Box Detection: The script automatically finds the highest high and lowest low over a defined period to draw a consolidation box.
Quality Filters: The box is only drawn if it meets specific quality criteria, such as a minimum number of touches on its ceiling (resistance) and floor (support), and if its height is within a user-defined percentage of the price.
Action Zones: The top and bottom sections of the box are colored to highlight "Action Zones." The lower zone (green) represents a potential support/buy area, while the upper zone (red) represents a potential resistance/sell area.
Quartile Levels: The indicator plots dashed lines at the 25%, 50%, and 75% levels of the box's range. The 50% line is highlighted with a darker color, serving as the primary equilibrium point or "mid-range."
Full Screener Integration: This indicator is built to work seamlessly with the TradingView Screener. You can scan for stocks, crypto, or forex pairs that are currently:
Inside a valid consolidation.
Trading at the bottom of the box (Support Action Zone).
Trading at the top of the box (Resistance Action Zone).
Fully Customizable: All key parameters, such as the lookback period, box height, and number of touches, are fully adjustable in the indicator's settings.
3. How to Use It (Visual Analysis on the Chart)
The Box: The top border of the box represents strong resistance, while the bottom border represents strong support for the current range.
Action Zones:
Green Zone (Lower): When the price enters this zone, it's near the major support of the range. Look for signs of bullish reversals or consider it a potential area to enter long positions.
Red Zone (Upper): When the price enters this zone, it's near the major resistance of the range. Look for signs of bearish reversals or consider it a potential area to take profit or enter short positions.
Quartile Levels:
50% Line (Dark Dashed): This is the equilibrium point. The price will often react to this level. A break above it can show strength, while a fall below it can show weakness within the range.
25% and 75% Lines (Lighter Dashed): These act as minor, intra-range support and resistance levels.
4. How to Use It with the Screener
This indicator's most powerful feature is its ability to scan the market. To use it:
Open the Stock, Forex, or Crypto Screener.
Click on the "Filters" button.
Scroll down the list and select this indicator: "Consolidation Box (com Níveis)".
You will see three filter conditions you can use:
In Consolidation: Set this to "True" to find all assets that are currently inside a valid, established consolidation box.
Action Zone (Support): Set this to "True" to find assets that are not only in a box but are also trading in the lower green zone—ideal for finding potential buy setups.
Action Zone (Resistance): Set this to "True" to find assets trading in the upper red zone—ideal for finding potential sell/short setups.
5. Settings / Inputs
Analysis Period (bars): The lookback period used to find the highest high and lowest low. This defines the length of the consolidation.
Maximum Box Height (%): The box will only be drawn if its total height is less than this percentage of its price. This filters out ranges that are too volatile or wide.
Minimum Ceiling Touches: The minimum number of times the price must have "touched" the upper resistance border for the box to be considered valid.
Minimum Floor Touches: The minimum number of times the price must have "touched" the lower support border for the box to be considered valid.
Touch Tolerance (%): Defines how close the price needs to get to a border to be counted as a "touch." For example, a value of 2% means a touch is registered if the price comes within 2% of the border's range.
Action Zone (%): The size of the upper and lower zones. A value of 30% means the bottom 30% of the box will be the green support zone, and the top 30% will be the red resistance zone.
Disclaimer: This indicator is for educational and analytical purposes only. It is not financial advice. Always perform your own due diligence and risk management before making any trading decisions.
Sürüm Notları
Updated English transcriptionSürüm Notları
Adjustment to run pine screener
Sürüm Notları
Addition of dashed lines at 25%, 50% and 75% of the consolidation rectangleSürüm Notları
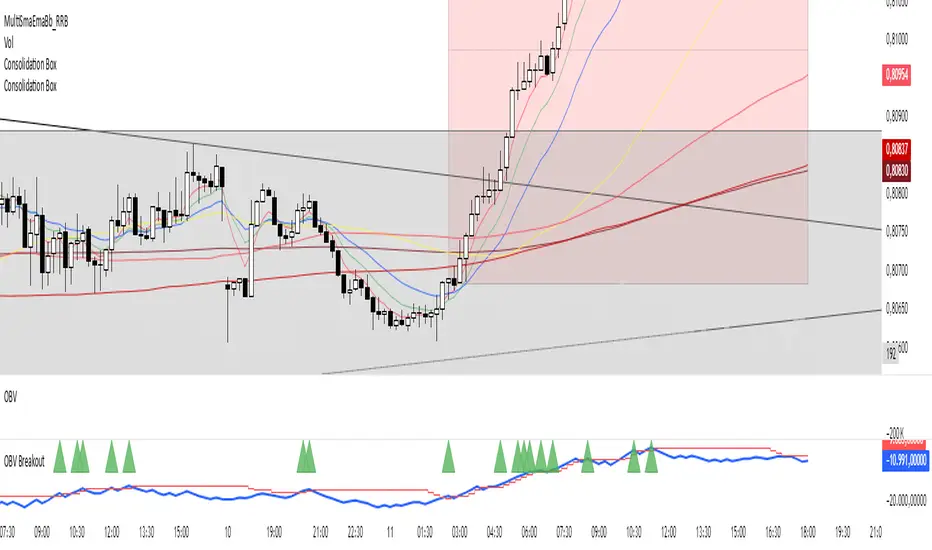
Documentation: Consolidation Box1. Overview
This Pine Script indicator is designed to automatically identify and qualify price consolidation zones (often called "boxes" or "ranges") based on a specific set of trading rules.
Its primary purpose is not just to draw boxes on the chart, but to find high-probability breakout setups by integrating key confirmation indicators like Moving Averages (EMAs), On-Balance Volume (OBV), and trading volume. The script features a powerful, built-in scoring system designed specifically for use with the TradingView Screener, allowing traders to efficiently scan the market for assets that are perfectly primed for a potential move.
2. Core Concept
The strategy is based on identifying periods where an asset's price is trading sideways between a clear support (floor) and resistance (ceiling). The core idea is to anticipate a breakout from this range. A simple breakout can be a false signal, so this script adds several layers of confirmation to qualify the setup's strength before it even happens. It looks for:
A well-defined consolidation box.
Confirmation from short-term and long-term trend indicators (EMAs).
Strength confirmation from volume-based indicators (OBV and Volume MA).
3. Key Features
Automatic Box Detection: Identifies consolidation ranges based on user-defined period and height criteria.
Multi-Factor Confirmation: Integrates EMAs, OBV, and Volume to validate the strength of a potential breakout.
Pre-Breakout Proximity Zone: Highlights when the price enters a "hot zone" very close to the box's ceiling or floor, serving as a pre-alert.
Advanced Screener Scoring: Assigns a numerical score based on how many rules are met, allowing for precise filtering in the TradingView Screener.
Customizable Alerts: Allows users to set alerts for the highest-probability setups.
Rich Visual Overlays: Clearly draws the box, internal support/resistance levels, and all moving averages on the chart.
4. How to Use
On the Chart
Add the script to your chart.
The indicator will automatically scan for consolidation boxes based on the default settings.
Observe the visual cues:
The color of the box indicates the current price location (see section 6).
The plotted EMAs show the underlying trend context.
With the TradingView Screener (Most Powerful Feature)
Open the Stock Screener.
Click the "Filters" button.
In the filter search bar, find the indicator by typing its name: Consolidation Box V4.
From the indicator's options, select the output value "Screener Score".
Set your filter conditions based on the score (see section 7 for a full breakdown):
For the strongest buy signals: Set filter to Screener Score | Equal | 5.
For all potential buy setups: Set filter to Screener Score | Greater Than | 3.
For the strongest sell signals: Set filter to Screener Score | Equal | -5.
For all potential sell setups: Set filter to Screener Score | Less Than | -3.
5. Configuration (Indicator Settings / Inputs)
You can customize the indicator's behavior through the "Settings" menu.
Box Identification Parameters
Analysis Period (bars): (Default: 63) The lookback period (in bars) to find the high and low of the consolidation.
Maximum Box Height (%): (Default: 25.0) The maximum allowed height of the box as a percentage of its floor price. This filters out ranges that are too wide or volatile.
Minimum Ceiling/Floor Touches: (Default: 2) The minimum number of times the price must "touch" the top and bottom boundaries for the box to be considered valid.
Touch Tolerance (%): (Default: 2.0) How close the price needs to get to a boundary to count as a "touch".
Action Zone (%): (Default: 30.0) Defines the upper and lower zones of the box. The box turns green or red when the price is in these zones.
Show Internal Lines: (Default: true) Toggles the visibility of the 25%, 50%, and 75% lines inside the box.
Confirmation Filter Parameters
Breakout Proximity (%): (Default: 2.0) This is crucial for pre-alerts. It defines the "hot zone." When the price is within this percentage of the ceiling/floor, the script considers it "about to break."
Volume MA Period: (Default: 20) The lookback period for the simple moving average of volume.
Enable/Disable Filters: (Defaults: true) These checkboxes allow you to individually enable or disable the confirmation filters for MAs (5,10,20), OBV, Volume, and Long MAs (200, 400).
6. Visual Elements on the Chart
The Consolidation Box:
Gray: A valid box is identified, but the price is in the neutral middle section.
Green: Price is in the lower "Action Zone" (potential buy area).
Red: Price is in the upper "Action Zone" (potential sell area).
Yellow: Price has entered the "Proximity Zone" and is very close to breaking out (up or down). This is the main pre-alert visual cue.
Internal Lines: Dotted lines representing the 25%, 50% (mid-point), and 75% levels of the box range.
Moving Averages (EMAs):
EMA 5 (Blue), EMA 10 (Orange), EMA 20 (Purple): Short-term trend and dynamic support/resistance.
EMA 200 (Red), EMA 400 (Maroon): Long-term trend context.
7. Screener Score Explained
The "Screener Score" is the core engine for filtering. Here is what each value means:
Score Condition Interpretation
5.0 About to Break Up + MA Confirmation + Volume/OBV Confirmation Highest Probability Buy Signal
4.0 About to Break Up + MA Confirmation (but not yet Volume/OBV) High Probability Buy Signal
3.0 About to Break Up (Price is in Proximity Zone) Potential Buy Setup, Awaiting Confirmation
2.0 Price is in the lower "Action Zone" Watching for strength
1.0 A valid consolidation box is found Neutral; asset is consolidating
0.0 No valid box found on the asset Ignore
-3.0 About to Break Down (Price is in Proximity Zone) Potential Sell Setup, Awaiting Confirmation
-4.0 About to Break Down + MA Confirmation High Probability Sell Signal
-5.0 About to Break Down + MA Confirmation + Volume/OBV Confirmation Highest Probability Sell Signal
Exportar para as Planilhas
8. Alerts
The script includes built-in alertcondition() calls. You can create alerts in TradingView for the following events:
MAX Buy Pre-Alert: Triggers when Screener Score equals 5.0.
Buy Pre-Alert (MAs): Triggers when Screener Score equals 4.0.
MAX Sell Pre-Alert: Triggers when Screener Score equals -5.0.
Sell Pre-Alert (MAs): Triggers when Screener Score equals -4.0.
9. Disclaimer
This indicator is a tool for technical analysis and should not be considered financial advice. Trading financial markets involves substantial risk, and past performance is not indicative of future results. Always conduct your own research and use proper risk management techniques before making any trading decisions. The creators of this script are not responsible for any financial losses.
Sürüm Notları
AjustSürüm Notları
AtualizationAçık kaynak kodlu komut dosyası
Gerçek TradingView ruhuyla, bu komut dosyasının mimarı, yatırımcıların işlevselliğini inceleyip doğrulayabilmesi için onu açık kaynaklı hale getirdi. Yazarı tebrik ederiz! Ücretsiz olarak kullanabilseniz de, kodu yeniden yayınlamanın Topluluk Kurallarımıza tabi olduğunu unutmayın.
Feragatname
Bilgiler ve yayınlar, TradingView tarafından sağlanan veya onaylanan finansal, yatırım, alım satım veya diğer türden tavsiye veya öneriler anlamına gelmez ve teşkil etmez. Kullanım Koşulları bölümünde daha fazlasını okuyun.
Açık kaynak kodlu komut dosyası
Gerçek TradingView ruhuyla, bu komut dosyasının mimarı, yatırımcıların işlevselliğini inceleyip doğrulayabilmesi için onu açık kaynaklı hale getirdi. Yazarı tebrik ederiz! Ücretsiz olarak kullanabilseniz de, kodu yeniden yayınlamanın Topluluk Kurallarımıza tabi olduğunu unutmayın.
Feragatname
Bilgiler ve yayınlar, TradingView tarafından sağlanan veya onaylanan finansal, yatırım, alım satım veya diğer türden tavsiye veya öneriler anlamına gelmez ve teşkil etmez. Kullanım Koşulları bölümünde daha fazlasını okuyun.