OPEN-SOURCE SCRIPT
VIX > 20/25 Highlight
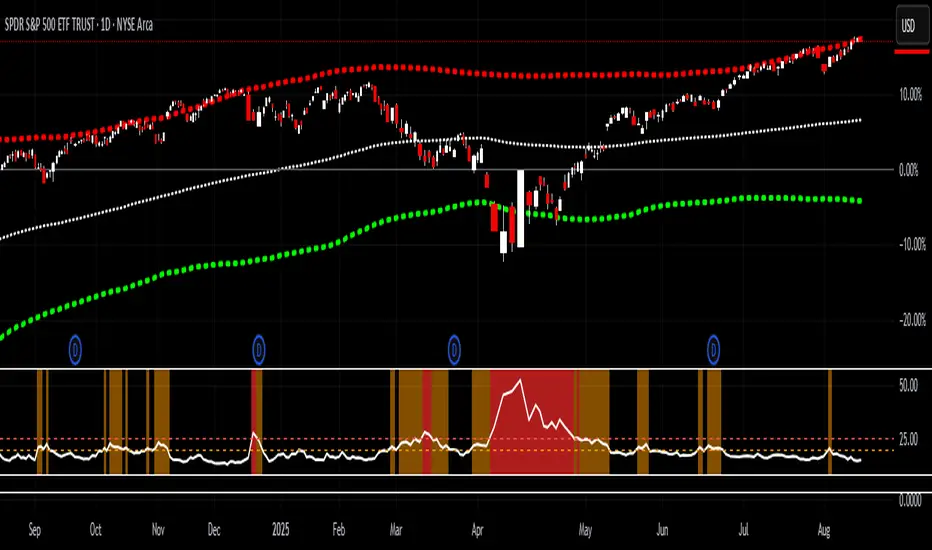
This indicator tracks the CBOE Volatility Index (VIX) and highlights when volatility exceeds critical thresholds.
Plots the VIX with dashed reference lines at 20 and 25.
Background turns orange when the VIX is above 20.
Background turns bright red when the VIX is above 25.
Includes alert conditions to notify you when the VIX crosses above 20 or 25.
Use this tool to quickly visualize periods of elevated market stress and manage risk accordingly.
Açık kaynak kodlu komut dosyası
Gerçek TradingView ruhuyla, bu komut dosyasının mimarı, yatırımcıların işlevselliğini inceleyip doğrulayabilmesi için onu açık kaynaklı hale getirdi. Yazarı tebrik ederiz! Ücretsiz olarak kullanabilseniz de, kodu yeniden yayınlamanın Topluluk Kurallarımıza tabi olduğunu unutmayın.
Feragatname
Bilgiler ve yayınlar, TradingView tarafından sağlanan veya onaylanan finansal, yatırım, alım satım veya diğer türden tavsiye veya öneriler anlamına gelmez ve teşkil etmez. Kullanım Koşulları bölümünde daha fazlasını okuyun.