OPEN-SOURCE SCRIPT
2024 - Seasonality - Open to Close
Script Description:
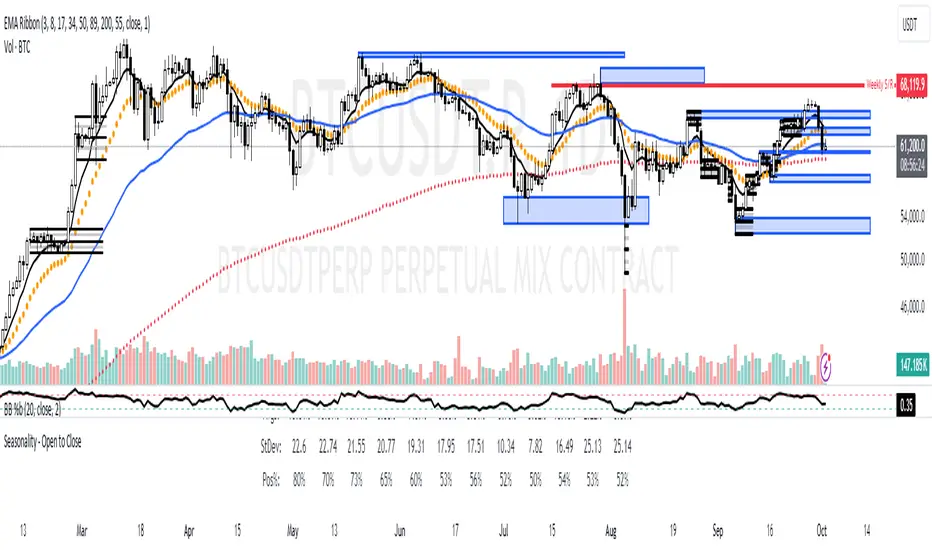
This Pine Script is designed to visualise **seasonality** in the financial markets by calculating the **open-to-close percentage change** for each month of a selected asset. It creates a **heatmap** table to display the monthly performance over multiple years. The script provides detailed statistical summaries, including:
- **Average monthly percentage changes**
- **Standard deviation** of the changes
- **Percentage of months with positive returns**
The script also allows users to adjust colour intensities for positive and negative values, specify which year to start from, and skip specific months. Key metrics such as averages, standard deviations, and percentages of positive months can be toggled on or off based on user preferences. The result is a clear, visual representation of how an asset typically performs month by month, aiding in seasonality analysis.
Açık kaynak kodlu komut dosyası
Gerçek TradingView ruhuyla, bu komut dosyasının mimarı, yatırımcıların işlevselliğini inceleyip doğrulayabilmesi için onu açık kaynaklı hale getirdi. Yazarı tebrik ederiz! Ücretsiz olarak kullanabilseniz de, kodu yeniden yayınlamanın Topluluk Kurallarımıza tabi olduğunu unutmayın.
Feragatname
Bilgiler ve yayınlar, TradingView tarafından sağlanan veya onaylanan finansal, yatırım, alım satım veya diğer türden tavsiye veya öneriler anlamına gelmez ve teşkil etmez. Kullanım Koşulları bölümünde daha fazlasını okuyun.