OPEN-SOURCE SCRIPT
Custom SMA Plot
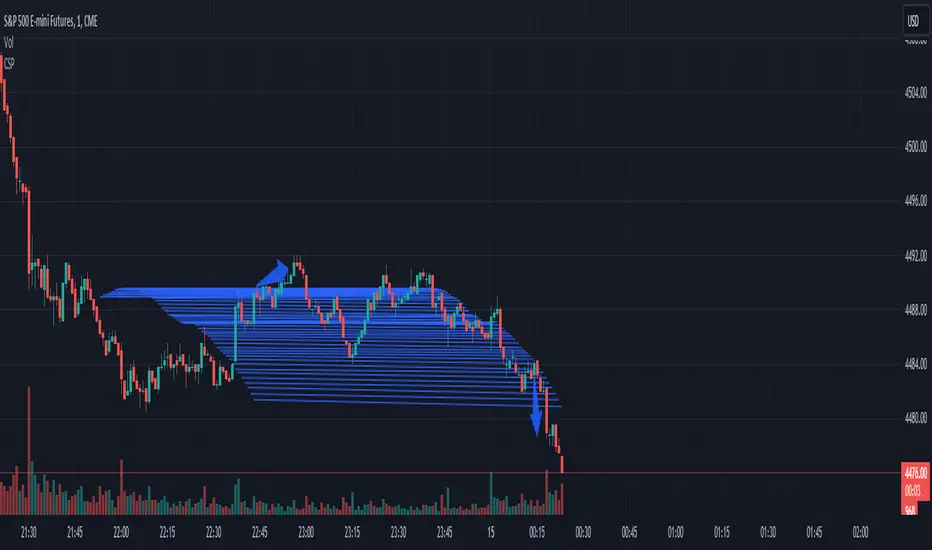
It creates a custom indicator named "Custom SMA Plot (CSP)" that overlays on a price chart. The indicator fetches the closing prices and calculates a 14-period simple moving average (SMA) of these prices. This SMA is then visually represented as a blue line, which starts from the SMA value of the bar 100 candles ago and extends to the current bar's SMA value. The line has a thickness of 1 unit.
When price breaks over wave go long.
When price breaks below wave go short.
When price breaks over wave go long.
When price breaks below wave go short.
Açık kaynak kodlu komut dosyası
Gerçek TradingView ruhuyla, bu komut dosyasının mimarı, yatırımcıların işlevselliğini inceleyip doğrulayabilmesi için onu açık kaynaklı hale getirdi. Yazarı tebrik ederiz! Ücretsiz olarak kullanabilseniz de, kodu yeniden yayınlamanın Topluluk Kurallarımıza tabi olduğunu unutmayın.
Feragatname
Bilgiler ve yayınlar, TradingView tarafından sağlanan veya onaylanan finansal, yatırım, alım satım veya diğer türden tavsiye veya öneriler anlamına gelmez ve teşkil etmez. Kullanım Koşulları bölümünde daha fazlasını okuyun.