PROTECTED SOURCE SCRIPT
Güncellendi Average Daily Range ADR by th
Special for Amer and ATR testing and some text for description which I will add a little bit later because beatiful tv can't pass my indicator to be published
Sürüm Notları
# Average Daily Range High Low v5 - ADR HiLo v5## 📊 Indicator Overview
**ADR HiLo v5** is a powerful indicator for analyzing Average Daily Range that helps traders identify potential support and resistance levels based on historical volatility data.
## 🎯 Key Features
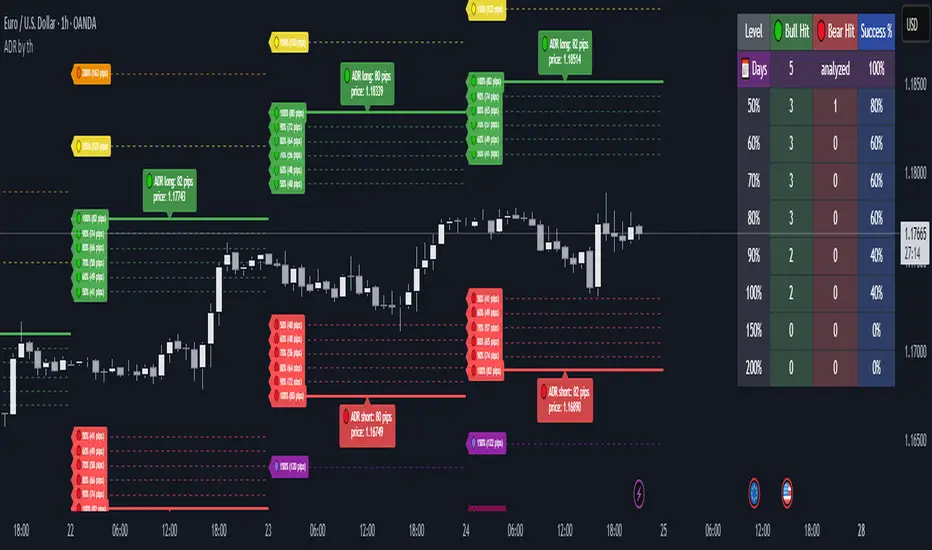
### 📈 ADR Visualization
- **Upper ADR Level** (🟢) - potential target for long positions
- **Lower ADR Level** (🔴) - potential target for short positions
- Display for last N days (configurable from 1 to 100)
### 📊 ADR Percentage Levels
The indicator shows additional ADR levels with color coding:
- **50-100%**: 🟢 Green/🔴 Red (standard levels)
- **101-150%**: 🟡 Yellow/🟣 Purple (extended levels)
- **151-200%**: 🟠 Orange/🟤 Brown (extreme levels)
### 📋 Statistics Table
Shows detailed statistics for each level hit rate:
- Number of days bullish levels were reached
- Number of days bearish levels were reached
- Overall success percentage for each level
- Number of analyzed days
## ⚙️ Settings
### 🔧 Core Parameters
- **ADR Length**: Period for calculating average range (default 14)
- **Show ADR for last N days**: Number of days to display (1-100)
- **Display as forex pips**: Show range in pips for forex pairs
### 🎨 Visual Settings
- **ADR Bull/Bear Colors**: Colors for bullish/bearish levels
- **Show ADR percentage levels**: Enable/disable percentage levels
- **Percentage levels**: Customizable levels (default: 50,60,70,80,90,100,150,200)
### 📊 Statistics
- **Show statistics table**: Enable/disable statistics table
- **Statistics position**: Table position on chart
## 🎯 How to Use
### 📈 For Trading
1. **Long positions**: Look for entry points near lower ADR levels with targets at upper levels
2. **Short positions**: Look for entry points near upper ADR levels with targets at lower levels
3. **Risk management**: Use statistics to assess probability of reaching levels
### 📊 Volatility Analysis
- High percentages of 100%+ level hits indicate high volatility
- Low percentages of basic level hits may signal changing market conditions
## 🔍 Features
### ✅ Advantages
- Automatic calculation of optimal levels based on historical data
- Detailed statistics for each level
- Color coding for easy recognition of level importance
- Forex pips support for currency pairs
- Customizable parameters for different trading styles
### 🎯 Suitable for
- Intraday trading
- Scalping
- Swing trading
- Market volatility analysis
## 📝 Notes
- Indicator designed for timeframes from 1 minute to 4 hours
- Best results on active markets with high liquidity
- Recommended to use in combination with other technical analysis methods
## 🔄 Version 5
This version includes:
- Enhanced statistics with detailed analysis
- Extended percentage levels up to 200%
- Optimized performance
- Better visualization with emojis and color coding
---
*This indicator is created to help traders identify potential support/resistance levels based on average daily range. Use at your own risk.*
Sürüm Notları
Overview:This indicator visualizes the Average Daily Range (ADR) for any market—optimized for Forex but useful across all symbols. It provides powerful range and volatility insights for the last N days, including percent-level ADR extensions, auto-stats, and clean visual labels.
Key Features:
Custom ADR Period:
Choose the length (default: 14 days) for your ADR calculation, adapting to your trading style.
ADR Levels & Labels:
Plots daily ADR high/low levels above and below each daily open. Each range is clearly marked with price and pip values for rapid decision-making.
Percentage Extensions:
See instantly where price extends to key ADR percentage levels (configurable, default: 50%, 60%, 70%, 80%, 90%, 100%, 150%, 200%), with color-coded lines and emoji labels for visual clarity.
Forex Pip Display:
Optionally view ADR and level distances in Forex pips for easier FX trading analysis.
Statistical Table:
Built-in stats table shows the number and rate of "hits" for each ADR percent extension, both bullish and bearish, so you can spot historical breakouts and overextensions at a glance.
Customizable Look & Feel:
Set colors for bull/bear ranges, move the stats table to any corner, and select how many days back you want to visualize—all from the settings panel.
How to Use:
Apply to Any Chart/TF:
Works best on intraday charts (15m, 30m, 1h) but can be used on any timeframe for context.
Levels and Entries:
Use the plotted ADR and percent levels as dynamic support/resistance, mean reversion, or breakout targets. The pip and price readouts simplify position sizing and risk management.
Range Expansion Awareness:
Spot overextended days or probable exhaustion points using the colored levels and historical statistics.
Who Is This For?
Day Traders & Scalpers:
Instantly know how much the market has moved vs. normal, and when it's statistically stretched.
Swing & Range Traders:
Identify prime reversal or fade zones based on historic range probabilities.
FX Traders:
Built-in pip mode and fine-tuned for Forex pairs.
Tips:
- The indicator auto-cleans previous drawings/labels for a tidy chart.
- You can fully adjust which ADR percentage levels are shown in the settings.
- The statistics table gives you real quantitative edge, not just visual cues.
Korumalı komut dosyası
Bu komut dosyası kapalı kaynak olarak yayınlanmaktadır. Ancak, ücretsiz ve herhangi bir sınırlama olmaksızın kullanabilirsiniz – daha fazla bilgiyi buradan edinebilirsiniz.
Feragatname
Bilgiler ve yayınlar, TradingView tarafından sağlanan veya onaylanan finansal, yatırım, alım satım veya diğer türden tavsiye veya öneriler anlamına gelmez ve teşkil etmez. Kullanım Koşulları bölümünde daha fazlasını okuyun.