OPEN-SOURCE SCRIPT
3M-10Y Yield Spread
3M-10Y Yield Spread Indicator Description
What It Is:
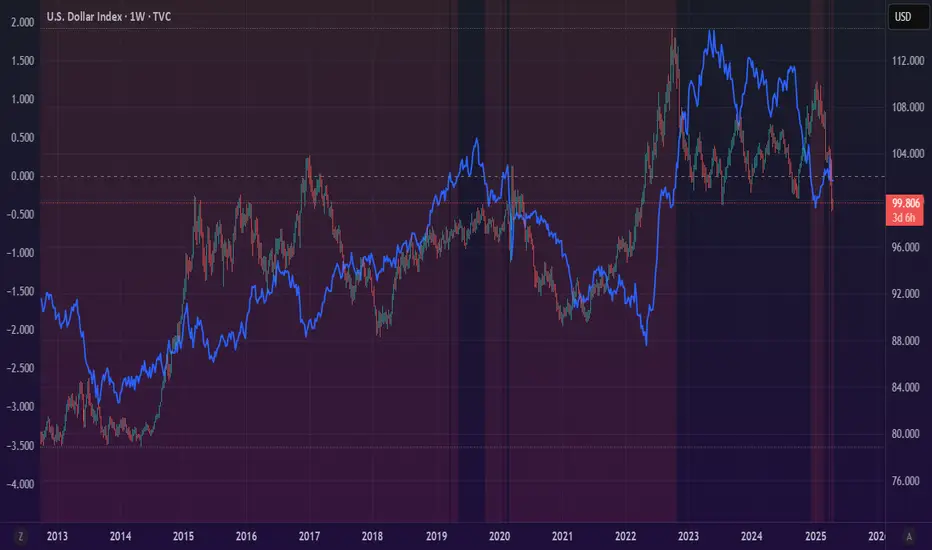
This indicator calculates the difference (spread) between the 3-month and 10-year US Treasury yields, plotted as a line with a zero reference. The background turns red when the spread inverts (falls below zero), signaling when the 3-month yield exceeds the 10-year yield.
What It Helps Understand:
Economic Health: An inverted yield curve (spread < 0) often predicts recessions, as it reflects market expectations of future economic slowdown, typically preceding downturns by 6-18 months.
Fed Policy Impact: Fed rate hikes can push short-term yields (like the 3-month) higher, potentially causing inversion if long-term yields (10-year) don’t rise as much due to growth concerns. Conversely, Fed rate cuts can lower short-term yields, steepening the curve (spread > 0), signaling economic stimulus or recovery expectations.
What It Is:
This indicator calculates the difference (spread) between the 3-month and 10-year US Treasury yields, plotted as a line with a zero reference. The background turns red when the spread inverts (falls below zero), signaling when the 3-month yield exceeds the 10-year yield.
What It Helps Understand:
Economic Health: An inverted yield curve (spread < 0) often predicts recessions, as it reflects market expectations of future economic slowdown, typically preceding downturns by 6-18 months.
Fed Policy Impact: Fed rate hikes can push short-term yields (like the 3-month) higher, potentially causing inversion if long-term yields (10-year) don’t rise as much due to growth concerns. Conversely, Fed rate cuts can lower short-term yields, steepening the curve (spread > 0), signaling economic stimulus or recovery expectations.
Açık kaynak kodlu komut dosyası
Gerçek TradingView ruhuyla, bu komut dosyasının mimarı, yatırımcıların işlevselliğini inceleyip doğrulayabilmesi için onu açık kaynaklı hale getirdi. Yazarı tebrik ederiz! Ücretsiz olarak kullanabilseniz de, kodu yeniden yayınlamanın Topluluk Kurallarımıza tabi olduğunu unutmayın.
Feragatname
Bilgiler ve yayınlar, TradingView tarafından sağlanan veya onaylanan finansal, yatırım, alım satım veya diğer türden tavsiye veya öneriler anlamına gelmez ve teşkil etmez. Kullanım Koşulları bölümünde daha fazlasını okuyun.