OPEN-SOURCE SCRIPT
Güncellendi Crash Stats 15m (ETH) — X% | prev RTH min(VWAP, Close)
# Crash Stats 15m (ETH) — X% Drawdown Event Analyzer
A 15-minute indicator that scans up to the last 5 years to find **crash events** where the close falls by at least **X%** relative to the **lower of** the prior day’s **RTH VWAP** and **RTH close**. It then measures recovery and follow-through behavior, tags the market regime around each event, and summarizes everything in a table.
---
## What the script detects
**Crash event (trigger):**
* On a 15-minute bar, `close <= refPrice * (1 - X%)`.
* `refPrice = min(previous RTH VWAP, previous RTH close)`.
* First touch only: subsequent bars below the threshold on the same trading day are ignored.
* Extended hours (ETH) are supported; if ETH is off, the script safely infers the previous RTH reference.
**Per-event measurements**
1. **Time to “turn up”** – first close **above the event-anchored AVWAP** (AVWAP cumulated from the trigger bar onward).
2. **Time to recover the reference price** – first close ≥ `refPrice`.
3. **Time to recover Y% above the crash-day average price** – first close ≥ `crashDayVWAP * (1+Y%)`.
4. **Post-crash lowest price & timing** – the lowest low and how long after the event it occurs, within a user-defined horizon (default 10 trading days, approximated in calendar days).
5. **Intraday RTH low timing** – on the crash day’s RTH session, when did the day’s intraday low occur, and **was it on the first 15-minute bar**?
6. **First 15-minute low of the RTH day** – recorded for context.
All durations are shown as **D days H hours M minutes**.
---
## Regime tagging (A / B)
For each event the script classifies the surrounding trend using daily closes:
* Let `r6m = (prevClose – close_6mAgo) / close_6mAgo`,
`r12m = (prevClose – close_12mAgo) / close_12mAgo`.
* **A**: both `r6m > 0` and `r12m > 0` (uptrend across 6m & 12m).
* **B**: one positive, one negative, and `r6m + r12m ≥ 0` (mixed but net non-negative).
* Otherwise: **—**.
This helps separate selloffs in strong uptrends (A) from mixed regimes (B) and others.
---
## Inputs
* **X — Crash threshold (%)**: default 5.
* **Y — Recovery above crash-day average (%)**: default 5.
* **Lookback years**: default 5 (bounded by data availability).
* **Horizon for post-crash lowest (trading days)**: default 10 (approximated as calendar days).
* **RTH session**: default `09:30–16:00` (exchange timezone).
* **Show markers**: plot labels on triggers.
* **Rows to display**: last N events in the table.
---
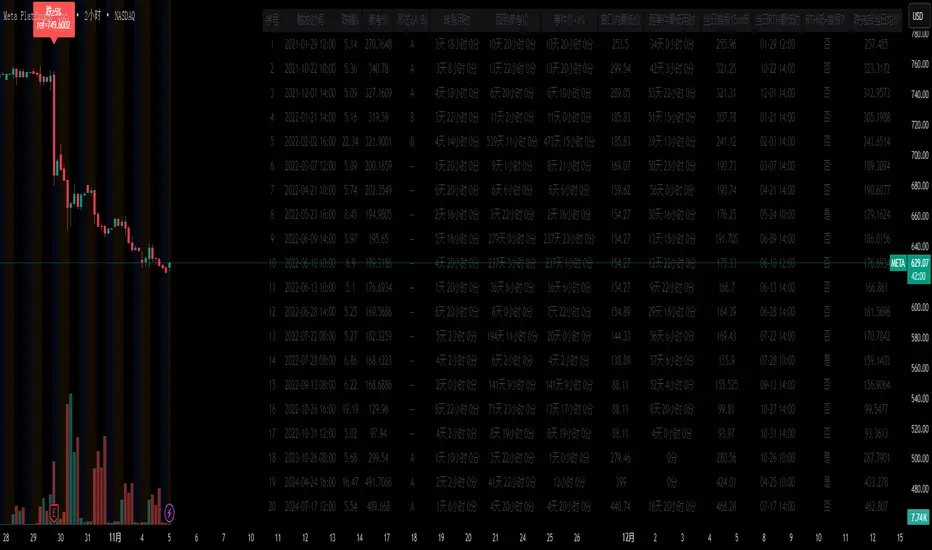
## Table columns
* Index, **Trigger time**, **Drop %**, **Ref price**, **Regime (A/B/—)**
* **Time to turn up** (above anchored AVWAP)
* **Time to ref price**, **Time to day VWAP + Y%**
* **Window lowest price**, **Time to window low**
* **RTH first-15m low**, **RTH lowest time**, **Was RTH low on first 15m?**
* **Crash-day VWAP**
---
## How to use
1. **Set chart to 15-minute** and **enable extended hours** for equities (recommended).
2. Keep defaults (**X=5%, Y=5%**) to start; tighten to 3–4% for more frequent events on less volatile symbols.
3. For non-US symbols or futures, adjust the **RTH session** if needed.
4. Read the table (top-right) for per-event diagnostics and aggregate averages (bottom row).
---
## Notes & implementation details
* Works whether ETH is on or off. If ETH is off, the script back-fills “previous RTH” references at the next RTH open and uses the prior daily close as a fallback.
* The “turn up” definition uses **event-anchored AVWAP**, a robust, price–volume anchor widely used for post-shock mean reversion analysis.
* Events are **de-duplicated**: only one event per trading day (per target RTH cycle).
* Lookback is limited by your plan and the data vendor. The script requests deep history (`max_bars_back=50000`), but availability varies by symbol.
* Durations use minute precision and are rendered as **days–hours–minutes** for readability.
---
## Quick troubleshooting
* **No events found**: lower **X%**, enable **ETH**, or ensure sufficient history is loaded (scroll back, or briefly switch to a higher timeframe to force deeper backfill, then return to 15m).
* **RTH boundaries off**: check the **RTH session** input matches the venue.
* **Few rows in table**: increase **Rows to display**.
---
## Typical use cases
* Back-test how fast different symbols tend to stabilize after a sharp gap-down or intraday shock.
* Compare recovery behavior across regimes **A / B** for sizing and risk timing.
* Build playbooks: e.g., if the RTH low occurs on the first 15m bar X% of the time, plan entries accordingly.
---
## Changelog
* **v1.0**: Initial public release with crash detection, anchored-AVWAP reversal, reference & VWAP+Y recovery timers, regime tagging, window-low timing, RTH low timing, and first-15m low capture.
A 15-minute indicator that scans up to the last 5 years to find **crash events** where the close falls by at least **X%** relative to the **lower of** the prior day’s **RTH VWAP** and **RTH close**. It then measures recovery and follow-through behavior, tags the market regime around each event, and summarizes everything in a table.
---
## What the script detects
**Crash event (trigger):**
* On a 15-minute bar, `close <= refPrice * (1 - X%)`.
* `refPrice = min(previous RTH VWAP, previous RTH close)`.
* First touch only: subsequent bars below the threshold on the same trading day are ignored.
* Extended hours (ETH) are supported; if ETH is off, the script safely infers the previous RTH reference.
**Per-event measurements**
1. **Time to “turn up”** – first close **above the event-anchored AVWAP** (AVWAP cumulated from the trigger bar onward).
2. **Time to recover the reference price** – first close ≥ `refPrice`.
3. **Time to recover Y% above the crash-day average price** – first close ≥ `crashDayVWAP * (1+Y%)`.
4. **Post-crash lowest price & timing** – the lowest low and how long after the event it occurs, within a user-defined horizon (default 10 trading days, approximated in calendar days).
5. **Intraday RTH low timing** – on the crash day’s RTH session, when did the day’s intraday low occur, and **was it on the first 15-minute bar**?
6. **First 15-minute low of the RTH day** – recorded for context.
All durations are shown as **D days H hours M minutes**.
---
## Regime tagging (A / B)
For each event the script classifies the surrounding trend using daily closes:
* Let `r6m = (prevClose – close_6mAgo) / close_6mAgo`,
`r12m = (prevClose – close_12mAgo) / close_12mAgo`.
* **A**: both `r6m > 0` and `r12m > 0` (uptrend across 6m & 12m).
* **B**: one positive, one negative, and `r6m + r12m ≥ 0` (mixed but net non-negative).
* Otherwise: **—**.
This helps separate selloffs in strong uptrends (A) from mixed regimes (B) and others.
---
## Inputs
* **X — Crash threshold (%)**: default 5.
* **Y — Recovery above crash-day average (%)**: default 5.
* **Lookback years**: default 5 (bounded by data availability).
* **Horizon for post-crash lowest (trading days)**: default 10 (approximated as calendar days).
* **RTH session**: default `09:30–16:00` (exchange timezone).
* **Show markers**: plot labels on triggers.
* **Rows to display**: last N events in the table.
---
## Table columns
* Index, **Trigger time**, **Drop %**, **Ref price**, **Regime (A/B/—)**
* **Time to turn up** (above anchored AVWAP)
* **Time to ref price**, **Time to day VWAP + Y%**
* **Window lowest price**, **Time to window low**
* **RTH first-15m low**, **RTH lowest time**, **Was RTH low on first 15m?**
* **Crash-day VWAP**
---
## How to use
1. **Set chart to 15-minute** and **enable extended hours** for equities (recommended).
2. Keep defaults (**X=5%, Y=5%**) to start; tighten to 3–4% for more frequent events on less volatile symbols.
3. For non-US symbols or futures, adjust the **RTH session** if needed.
4. Read the table (top-right) for per-event diagnostics and aggregate averages (bottom row).
---
## Notes & implementation details
* Works whether ETH is on or off. If ETH is off, the script back-fills “previous RTH” references at the next RTH open and uses the prior daily close as a fallback.
* The “turn up” definition uses **event-anchored AVWAP**, a robust, price–volume anchor widely used for post-shock mean reversion analysis.
* Events are **de-duplicated**: only one event per trading day (per target RTH cycle).
* Lookback is limited by your plan and the data vendor. The script requests deep history (`max_bars_back=50000`), but availability varies by symbol.
* Durations use minute precision and are rendered as **days–hours–minutes** for readability.
---
## Quick troubleshooting
* **No events found**: lower **X%**, enable **ETH**, or ensure sufficient history is loaded (scroll back, or briefly switch to a higher timeframe to force deeper backfill, then return to 15m).
* **RTH boundaries off**: check the **RTH session** input matches the venue.
* **Few rows in table**: increase **Rows to display**.
---
## Typical use cases
* Back-test how fast different symbols tend to stabilize after a sharp gap-down or intraday shock.
* Compare recovery behavior across regimes **A / B** for sizing and risk timing.
* Build playbooks: e.g., if the RTH low occurs on the first 15m bar X% of the time, plan entries accordingly.
---
## Changelog
* **v1.0**: Initial public release with crash detection, anchored-AVWAP reversal, reference & VWAP+Y recovery timers, regime tagging, window-low timing, RTH low timing, and first-15m low capture.
Sürüm Notları
# Crash Stats 15m (ETH) – Publication NotesA 15-minute scanner that finds historical crash events and measures how prices recover. It works on both RTH and ETH, and is designed for repeatable, exportable research.
## What it detects
An event is triggered when the 15-minute close falls by at least X% versus the reference price:
* Reference = min(previous RTH VWAP, previous RTH close).
* Default X = 5%.
* Events are de-duplicated: at most one event per trading day.
## What it measures (per event)
1. Time to turn up
First 15-minute bar where both conditions hold:
* Close > previous day’s close, and
* Today’s natural-day VWAP > previous day’s natural-day VWAP.
2. Time to reclaim reference price
First close ≥ the reference price defined above.
3. Time to recover Y% from the event base
* Event base = the event bar’s close.
* If the event occurs in ETH and the option is enabled, the base is updated to the lowest low observed until the next RTH open (captures “post-crash final dip”).
* Target = base × (1 + Y%). Default Y = 5%.
4. Post-crash window low
Lowest price and its time within a user-set window (approx. N trading days, implemented with natural days). Default window = 10 days.
5. RTH intraday extremes on the crash day
* First 15-minute bar’s low.
* RTH session’s lowest price and its timestamp.
* Boolean: did the RTH low occur on the first 15-minute bar?
6. Regime label (A/B) at the time of crash
* A: 6-month return > 0 and 12-month return > 0 (using the prior day’s closes).
* B: one positive and one negative, with (6m + 12m) ≥ 0.
* Else: —.
## Inputs
* X — Drop threshold (%) [default 5.0]
* Y — Recovery from event base (%) [default 5.0]
* Lookback years [default 5]
* Post-crash window (trading days) [default 10]
* RTH session time [default 09:30–16:00 exchange time]
* Show markers on chart [on]
* Table rows to display [default 40]
* Y% base update in ETH [on]
* Export settings:
* Enable export via Data Window
* Persist one bar (keeps values one extra bar to make Export easier)
* Optional: snapshot-to-alert/Webhook chunks (CSV)
## Table columns
* ID
* Trigger time (exchange time)
* Drop% (vs reference)
* Reference price
* Regime (A/B/—)
* Time to turn up
* Time to reference
* Time to Y% recovery (from event base; ETH base trailing if enabled)
* Window low (price)
* Time to window low
* First 15m low (crash day)
* RTH low time (crash day)
* RTH low is first-15m?
* Crash-day natural-day VWAP (for context)
Times are shown as d h m in the on-chart table; exported values are in minutes.
## ETH/RTH handling
* Reference uses the previous RTH only.
* Event detection runs on all bars (ETH included).
* If the crash occurs in ETH and the option is on, the Y% base trails to the lowest low until the next RTH open, then freezes.
## How to use
1. Add to a 15-minute chart. For ETH analysis, enable Extended Hours in TradingView.
2. Set X/Y, lookback years, post-crash window, and RTH session to match the venue.
3. Read the table for the last N events; markers show trigger bars.
4. For CSV:
* Turn on Enable export (Data Window).
* Use TradingView’s Export chart data; the series are named exp_*.
* Or enable snapshot-to-alert to push a full CSV via Any alert() function call.
## Notes and limits
* 15-minute resolution is assumed for triggers and timing. You can view on other timeframes, but precision is anchored to 15m closes.
* Post-crash window approximates trading days with natural days; ±1 day drift is possible on illiquid symbols/holidays.
* Backfill of previous-RTH reference is handled whether ETH is on or off.
* Historical depth depends on your data plan; some symbols may not have full 5-year 15m history.
## Interpretation tips
* A vs B regimes often split “crashes in uptrends” vs “mixed/transition regimes.” Compare average times across regimes.
* The ETH trailing-low base is useful for after-hours dumps; disable it if you prefer a strictly event-bar-close baseline.
* Combine with volatility or liquidity filters when comparing symbols.
## Change log (current)
* Turn-up definition changed to Close > prior day’s Close and Today VWAP > prior day VWAP.
* Y% recovery now uses event base; optional ETH trailing-low until next RTH.
* Added first-15m low, RTH low timing/flag, regime labels, and robust export paths.
* De-duplicate events within one trading day.
If you want, I can add a short, punchy marketplace blurb and screenshots checklist to go with this.
Sürüm Notları
# Crash Stats 15m (ETH) — Publication NotesA 15-minute research tool that finds historical crash events and measures how prices recover across ETH and RTH. Built for reproducible stats and export.
# What it detects
An event triggers when the 15-minute close falls by at least X% versus the reference price:
* Reference price = min(previous RTH VWAP, previous RTH close).
* Default X = 5%.
* De-duplication: at most one event per trading day.
# What it measures per event
1. Time to turn up
First 15-minute bar where both hold:
* Close > prior day’s close, and
* Today’s natural-day VWAP > prior day’s natural-day VWAP.
2. Time to reclaim reference
First close ≥ reference price.
3. Time to recover Y% from the event base
* Base = event bar’s close.
* If the event is in ETH and the option is enabled, the base trails to the lowest low until the next RTH open, then freezes.
* Target = base × (1 + Y%), default Y = 5%.
4. Post-crash window low
Lowest price and its timestamp within a user window (approx. N trading days, implemented with natural days). Default = 10.
5. RTH intraday extremes on the crash day
* First 15-minute bar low.
* RTH session lowest price and its timestamp.
* Flag: did the RTH low occur on the first 15-minute bar.
6. Regime label at crash time
* A: 6-month return > 0 and 12-month return > 0 (using prior-day closes).
* B: one positive and one negative, with 6m + 12m ≥ 0.
* Else: —.
7. Post-dip same-day average price
Average price from the dip-base timestamp to that natural day’s end (VWAP from base-time to 24:00). Matches the Y% base logic, including ETH trailing until next RTH if enabled.
# Inputs
* X: drop threshold percent (default 5.0)
* Y: recovery from event base percent (default 5.0)
* Lookback years (default 5)
* Post-crash window length in trading days (default 10)
* RTH session time (default 09:30–16:00, exchange time)
* Show chart markers (on)
* Table rows to display (default 40)
* ETH base trailing for Y% (on)
* Export options
* Data Window export (numeric exp_* series)
* Snapshot-to-alert/Webhook CSV (time strings consistent with the on-chart table)
# Table columns
* ID
* Trigger time (exchange time)
* Drop% (vs reference)
* Reference price
* Regime (A/B/—)
* Time to turn up
* Time to reference
* Time to Y% recovery
* Window low (price)
* Time to window low
* First 15m low (crash day)
* RTH low time (crash day)
* RTH low is first-15m
* Post-dip same-day average price
On-chart times are rendered as d h m. Webhook CSV uses the same human-readable format; Data Window export uses minutes for machine use.
# ETH/RTH handling
* Reference uses previous RTH only.
* Detection runs on all bars.
* For ETH events with trailing enabled, the Y% base and the dip-base timestamp update to the lowest low until the next RTH open; post-dip average then freezes for that natural day.
# How to use
1. Add on a 15-minute chart; enable Extended Hours for ETH.
2. Set X, Y, lookback, window, and RTH session for the venue.
3. Read the table for the last N events; markers show triggers.
4. Export
* Data Window: enable export, use TradingView’s Export chart data to get exp_* numeric series.
* Webhook: enable snapshot export, create an alert with Any alert() function call to receive full CSV chunks containing table-style time strings and postdip_avg.
# Notes and limits
* Precision is anchored to 15-minute closes.
* Window uses natural days to approximate trading days; ±1 day drift is possible around holidays/illiquid symbols.
* Historical depth depends on your data plan; some symbols may not provide full 5-year 15-minute history.
# Interpretation tips
* Compare recovery timings across regimes A vs B to separate crashes in uptrends vs mixed regimes.
* ETH trailing is helpful for after-hours dumps; turn it off if you prefer a strict event-bar baseline.
* Combine with volatility/liquidity filters when comparing symbols.
# Change log (current)
* Turn-up definition switched to close > prior close and today VWAP > prior day VWAP.
* Y% recovery now from event base; optional ETH trailing to next RTH.
* Added post-dip same-day average price and aligned webhook CSV times with the table.
* Added first-15m low, RTH low timing/flag, regime labels, robust export paths, and per-day de-duplication.
Marketplace blurb
A 15-minute ETH/RTH crash scanner that tags X% selloffs, measures multiple recovery clocks, and exports clean stats. Supports ETH trailing bases, regime labeling, window lows, first-15m/RTH lows, and post-dip same-day averages with table-style time formatting.
Açık kaynak kodlu komut dosyası
Gerçek TradingView ruhuna uygun olarak, bu komut dosyasının oluşturucusu bunu açık kaynaklı hale getirmiştir, böylece yatırımcılar betiğin işlevselliğini inceleyip doğrulayabilir. Yazara saygı! Ücretsiz olarak kullanabilirsiniz, ancak kodu yeniden yayınlamanın Site Kurallarımıza tabi olduğunu unutmayın.
Feragatname
Bilgiler ve yayınlar, TradingView tarafından sağlanan veya onaylanan finansal, yatırım, işlem veya diğer türden tavsiye veya tavsiyeler anlamına gelmez ve teşkil etmez. Kullanım Şartları'nda daha fazlasını okuyun.