PROTECTED SOURCE SCRIPT
Candle Range Theory - Higher-Timeframe Scanner
The CRT Range Scanner is a sophisticated trading tool that identifies potential Candle Range Theory (CRT) completions across multiple timeframes. Based on the Inner Circle Trader methodology, this indicator helps traders spot key market structure breaks and range expansions.
Key Features:
🔍 Higher-Timeframe Analysis: Automatically detects CRT patterns on higher timeframes while you trade on lower timeframes
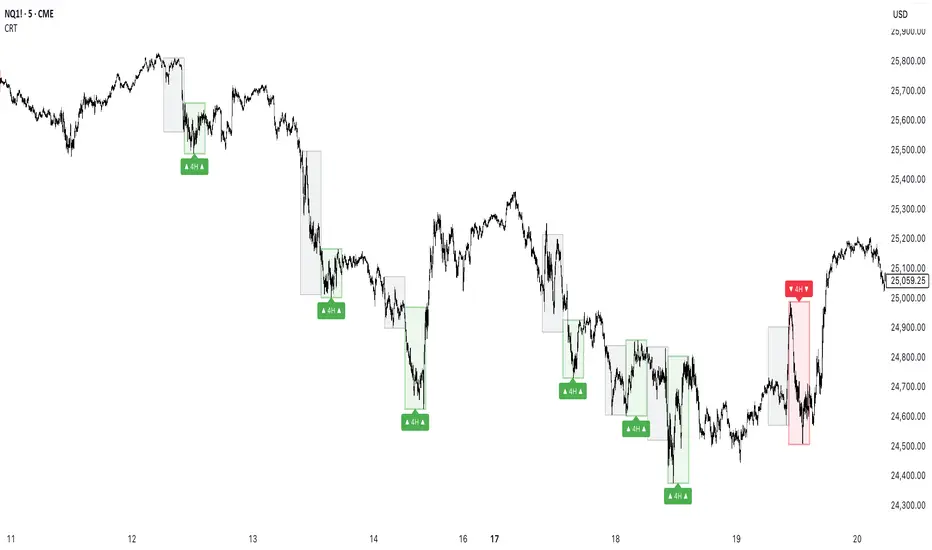
🎯 Bullish & Bearish CRT Signals: Identifies both bullish (range expansion to downside) and bearish (range expansion to upside) completions
⏰ Kill Zone Filtering: Customizable trading sessions to focus only on high-probability market hours
📊 Visual Range Boxes: Clear visual representation of current and previous higher timeframe ranges
🏷️ Smart Labeling: Timeframe-specific labels for easy pattern recognition
How It Works:
Bullish CRT: Occurs when price breaks below previous low during specific session times, indicating potential bullish reversal
Bearish CRT: Occurs when price breaks above previous high during specific session times, indicating potential bearish reversal
The indicator draws colored boxes around the relevant price ranges and provides clear visual cues for pattern recognition
Key Features:
🔍 Higher-Timeframe Analysis: Automatically detects CRT patterns on higher timeframes while you trade on lower timeframes
🎯 Bullish & Bearish CRT Signals: Identifies both bullish (range expansion to downside) and bearish (range expansion to upside) completions
⏰ Kill Zone Filtering: Customizable trading sessions to focus only on high-probability market hours
📊 Visual Range Boxes: Clear visual representation of current and previous higher timeframe ranges
🏷️ Smart Labeling: Timeframe-specific labels for easy pattern recognition
How It Works:
Bullish CRT: Occurs when price breaks below previous low during specific session times, indicating potential bullish reversal
Bearish CRT: Occurs when price breaks above previous high during specific session times, indicating potential bearish reversal
The indicator draws colored boxes around the relevant price ranges and provides clear visual cues for pattern recognition
Korumalı komut dosyası
Bu komut dosyası kapalı kaynak olarak yayınlanmaktadır. Ancak, ücretsiz ve herhangi bir sınırlama olmaksızın kullanabilirsiniz – daha fazla bilgiyi buradan edinebilirsiniz.
Luck Is What Happens When Preparation Meets Opportunity
Feragatname
Bilgiler ve yayınlar, TradingView tarafından sağlanan veya onaylanan finansal, yatırım, alım satım veya diğer türden tavsiye veya öneriler anlamına gelmez ve teşkil etmez. Kullanım Koşulları bölümünde daha fazlasını okuyun.