OPEN-SOURCE SCRIPT
Güncellendi Symbol Correlation
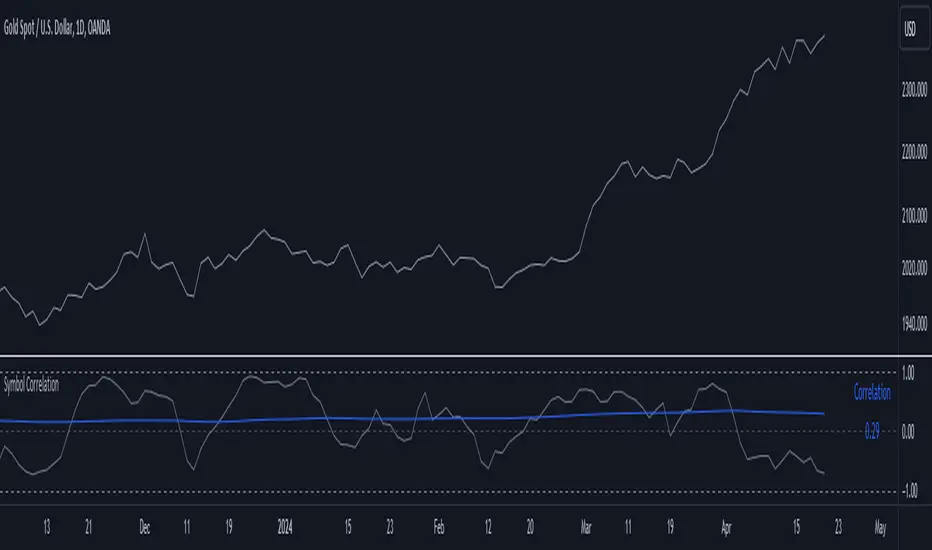
The "Symbol Correlation" indicator calculates and displays the correlation between the chosen symbol's price and another selected source over a specified period. It also includes a moving average (SMA) of this correlation to provide a smoothed view of the relationship.
Why SMA and Table Display ?
The inclusion of SMA (Simple Moving Average) with adjustable length (SMA Length) enhances the indicator's utility by smoothing out short-term fluctuations in correlation, allowing for clearer trend identification. The SMA helps to visualize the underlying trend in correlation, making it easier to spot changes and patterns over time.
The table display of the correlation SMA value offers a concise summary of this trend. By showcasing the current correlation SMA alongside its historical values, traders can quickly gauge the relationship's strength relative to previous periods.
Interpreting the Indicator:
1. Correlation Values: The primary plot shows the raw correlation values between the symbol's price and the specified source. A value of 1 indicates a perfect positive correlation, -1 signifies a perfect negative correlation, and 0 suggests no linear relationship.
2. Correlation SMA: The SMA line represents the average correlation over a defined period (SMA Length). Rising SMA values indicate strengthening correlation trends, while declining values suggest weakening correlations.
3. Choosing SMA Length: Traders can adjust the SMA Length parameter to tailor the moving average to their specific analysis horizon. Shorter SMA lengths react quickly to price changes but may be more volatile, while longer SMA lengths smooth out noise but respond slower to recent changes.
In summary, the "Symbol Correlation" indicator is a valuable tool for assessing the evolving relationship between a symbol's price and an external source. Its use of SMA and tabular presentation facilitates a nuanced understanding of correlation trends, aiding traders in making informed decisions based on market dynamics.
Sürüm Notları
Minor UpdateSürüm Notları
Major Update: added 3 symbols to facilitate correlation comparisons.Sürüm Notları
Minor UpdateAçık kaynak kodlu komut dosyası
Gerçek TradingView ruhuna uygun olarak, bu komut dosyasının oluşturucusu bunu açık kaynaklı hale getirmiştir, böylece yatırımcılar betiğin işlevselliğini inceleyip doğrulayabilir. Yazara saygı! Ücretsiz olarak kullanabilirsiniz, ancak kodu yeniden yayınlamanın Site Kurallarımıza tabi olduğunu unutmayın.
The trend is your friend, until it's not...
Feragatname
Bilgiler ve yayınlar, TradingView tarafından sağlanan veya onaylanan finansal, yatırım, işlem veya diğer türden tavsiye veya tavsiyeler anlamına gelmez ve teşkil etmez. Kullanım Şartları'nda daha fazlasını okuyun.
Açık kaynak kodlu komut dosyası
Gerçek TradingView ruhuna uygun olarak, bu komut dosyasının oluşturucusu bunu açık kaynaklı hale getirmiştir, böylece yatırımcılar betiğin işlevselliğini inceleyip doğrulayabilir. Yazara saygı! Ücretsiz olarak kullanabilirsiniz, ancak kodu yeniden yayınlamanın Site Kurallarımıza tabi olduğunu unutmayın.
The trend is your friend, until it's not...
Feragatname
Bilgiler ve yayınlar, TradingView tarafından sağlanan veya onaylanan finansal, yatırım, işlem veya diğer türden tavsiye veya tavsiyeler anlamına gelmez ve teşkil etmez. Kullanım Şartları'nda daha fazlasını okuyun.