OPEN-SOURCE SCRIPT
UCS_Cycle
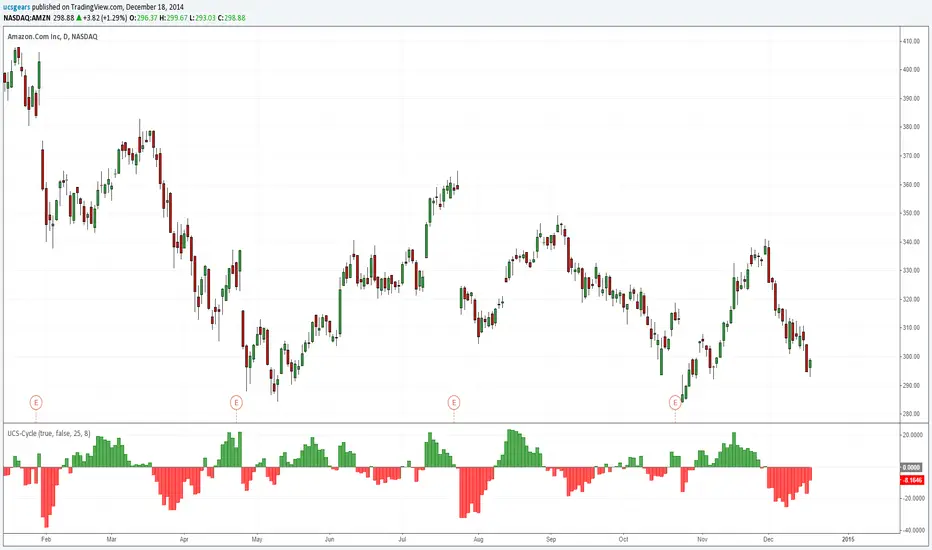
This indicator was designed to remove trend from price and make it easier to identify cycles.
Although this indicator has similarities to MACD. It is better used to identify the cycle of High and Lows based on the Statistical Data (Default is set to 25).
**** DO NOT USE THIS AS A MOMENTUM INDICATOR ****
Although this indicator has similarities to MACD. It is better used to identify the cycle of High and Lows based on the Statistical Data (Default is set to 25).
**** DO NOT USE THIS AS A MOMENTUM INDICATOR ****
Açık kaynak kodlu komut dosyası
Gerçek TradingView ruhuna uygun olarak, bu komut dosyasının oluşturucusu bunu açık kaynaklı hale getirmiştir, böylece yatırımcılar betiğin işlevselliğini inceleyip doğrulayabilir. Yazara saygı! Ücretsiz olarak kullanabilirsiniz, ancak kodu yeniden yayınlamanın Site Kurallarımıza tabi olduğunu unutmayın.
Uday C Santhakumar
Feragatname
Bilgiler ve yayınlar, TradingView tarafından sağlanan veya onaylanan finansal, yatırım, işlem veya diğer türden tavsiye veya tavsiyeler anlamına gelmez ve teşkil etmez. Kullanım Şartları'nda daha fazlasını okuyun.