Power Trend [MacAlgo]Description:
The Power Trend Indicator is a sophisticated technical analysis tool that overlays on your trading charts to identify prevailing market trends. It utilizes a combination of ATR-based trend calculations, moving averages, volume analysis, and momentum indicators to generate reliable buy and sell signals. Additionally, it offers customizable settings to adapt to various trading styles and timeframes.
Key Features:
Adaptive ATR Calculation: Automatically adjusts the ATR (Average True Range) period and multiplier based on the selected timeframe for more accurate trend detection.
Dynamic Trend Lines: Plots continuous trend lines with color-coded bars to visually represent bullish and bearish trends.
Buy/Sell Signals: Generates standard and power buy/sell signals to help you make informed trading decisions.
Volume Analysis: Incorporates average buy and sell volumes to identify strong market movements.
Multiple Timeframe Support: Automatically adjusts the indicator's timeframe or allows for manual selection to suit your trading preferences.
Highlighting: Highlights trending bars for easy visualization of market conditions.
Alerts: Customizable alert conditions to notify you of potential trading opportunities in real-time.
How it Works:
1. ATR-Based Trend Calculation:
ATR Period & Multiplier: Calculates ATR based on user-defined periods and multipliers, dynamically adjusting according to the chart's timeframe.
Trend Determination: Identifies trends as bullish (1) or bearish (-1) based on price movements relative to ATR-based upper (up) and lower (dn) trend lines.
2. Moving Averages:
EMA & SMA: Calculates exponential and simple moving averages to smooth price data and identify underlying trends.
AlphaTrend Line: Combines a 50-period EMA and a 30-period SMA on a 4-hour timeframe to create the AlphaTrend line, providing a robust trend reference.
3. Volume Analysis:
Buy/Sell Volume: Differentiates between buy and sell volumes to gauge market strength.
Average Volume: Compares current volume against average buy/sell volumes to detect significant market movements.
4. Momentum Indicators:
RSI, MACD, OBV: Incorporates Relative Strength Index (RSI), Moving Average Convergence Divergence (MACD), and On-Balance Volume (OBV) to assess momentum and confirm trend strength.
5. Signal Generation:
Standard Signals: Basic buy and sell signals based on trend crossovers.
Power Signals: Enhanced signals requiring multiple conditions (e.g., increased volume, momentum confirmation) for higher confidence trades.
Customization Options:
Tailor the Power Trend Indicator to your specific trading needs with the following settings:
ATR Period: Set the period for ATR calculation (default: 8).
ATR Multiplier: Adjust the ATR multiplier to fine-tune trend sensitivity (default: 3.0).
Source: Choose the price source (e.g., HL2, Close) for calculations.
Change ATR Calculation Method: Toggle between different ATR calculation methods.
Show Buy/Sell Signals: Enable or disable the display of buy and sell signals on the chart.
Highlighting: Turn on or off the bar highlighting feature.
Timeframe Adjustment: Choose between automatic timeframe adjustment or manually set
the indicator's timeframe.
Manual Indicator Timeframe: If manual adjustment is selected, specify the desired timeframe (default: 60 minutes).
Visual Components:
Trend Lines: Continuous lines representing the current trend, color-coded for easy identification (green for bullish, red for bearish, orange for neutral).
Bar Coloring: Bars are colored based on the current trend and its relationship to the AlphaTrend line.
Buy/Sell Triangles: Triangular markers appear on the chart to indicate buy and sell signals.
Power Signals: Larger triangles highlight strong buy and sell opportunities based on multiple confirming factors.
Highlighting: Transparent overlays highlight trending areas to enhance visual clarity.
Alerts:
Stay informed with customizable alerts that notify you of important market movements:
SuperTrend Buy/Sell: Alerts when standard buy or sell signals are generated.
Power Buy/Sell Alerts: Notifications for strong buy or sell signals based on comprehensive conditions.
Trend Direction Change: Alerts when the trend changes from bullish to bearish or vice versa.
How to Use:
Add to Chart: Apply the Power Trend Indicator to your preferred trading chart on TradingView.
Configure Settings: Adjust the input parameters to match your trading style and the timeframe you are analyzing.
Analyze Trends: Observe the trend lines, bar colors, and AlphaTrend line to understand the current market trend.
Follow Signals: Look for buy and sell signals or power signals to identify potential entry and exit points.
Set Alerts: Enable alerts to receive real-time notifications of significant trading opportunities.
Adjust as Needed: Fine-tune the settings based on market conditions and your trading experience.
Important Notes:
Backtesting: While the Power Trend Indicator is built using robust technical analysis principles, it's essential to backtest and validate its performance within your trading strategy.
Market Conditions: The indicator performs best in trending markets. In sideways or highly volatile markets, signal reliability may vary.
Risk Management: Always employ proper risk management techniques when trading based on indicator signals to protect your capital.
Disclaimer:
This indicator is intended for educational purposes only and does not provide financial advice or guarantee future performance. Trading involves risk, and past results are not indicative of future outcomes. Always conduct your own analysis and risk management.
Power

VaR Market Sentiment by TenozenHello there! I am excited to share with you my new trading concept implemented in the "VaR Market Sentiment" indicator. But before that, let me explain what VaR is. VaR, or Value at Risk, is an indicator that helps you identify the worst-case scenario of a market movement based on a percentile/confidence level. This means that it calculates the worst moves, whether it's a buy or sell, based on the timeframe you're using.
Now, let's discuss how VaR Market Sentiment works. It uses a historical VaR to calculate the worst move either if the market goes up or down based on a percentile/confidence level. The default setting is the 95th percentile, which means that the market is unlikely to hit your SL level within the day if you're using a daily timeframe, etc.
To determine the strength of a candle, it subtracts the value of both sides based on the returns of the current timeframe with the VaR value (Bullish VaR - Bullish Returns, Bearish VaR - Bearish Returns). If the result is above the mean, the current candle is potentially weak. Conversely, if the result is below the mean, the current candle is potentially strong. The deviation shows critical sentiments, where if the market is above the deviation, it means that the current candle is really weak. If it's below the deviation, it means that the current candle is really strong.
It's important to note that this indicator needs other supporting indicators such as trend-following or mean reversion indicators based on your trading style. Also, as a follow-up to my previous concept, I called out that the market has what's called "power." And for now, I conclude that VaR Market Sentiment is the "power."
I'm going to share more helpful indicators in the future! I hope this indicator will be helpful for you guys! Ciao!

Power Of Stocks - Bollinger Band & 5Ema Indicator - Keanu_RiTz
Power of Stocks - Bollinger band & 5ema Strategy
In this script you get to take Buy/Sell trades using the 3 options mentioned below.(Alerts with price levels for buy/sell at , SL & Target are included in this one)
1. Combined Strategy :- uses confirmation from both strategies to trade.
2. Bollinger band Strategy :- use the Bollinger band Strategy to trade.
3. 5ema Strategy :- use the 5ema Strategy to trade.
1. Combined Strategy :-
for Selling :- we will go short/sell only when conditions of both strategies are satisfied.
i.e. when a candle is completely above the upper Bollinger band & completely above the 5ema then it will be our Alert Candle.
We Short/Sell only when the low of the Alert candle is broken or when the candle closes below the close of the Alert Candle.
SL will be above high of the Alert Candle. Target will be minimum 1:3 or as per your emotions.
for Buying:- we will go Long/Buy only when conditions of both strategies are satisfied.
i.e. when a candle is completely below the lower Bollinger band & completely below the 5ema then it will be our Alert Candle.
We go Long/Buy only when the high of the Alert candle is broken or when the candle closes above the close of the Alert Candle.
SL will be below low of the Alert Candle. Target will be minimum 1:3 or as per your emotions.
2. Power of Stocks - Bollinger Band Strategy :-
Bollinger band with standard deviation = 1.5
when a candle is completely above the upper Bollinger band, that candle will be called a signal/alert candle.
Initiate a Sell trade when that alert candles low is broken. SL will be above high of that alert candle.
Risk to reward ratio will be 1:4 i.e. target will be 4 times the SL.
when a candle is completely below the lower Bollinger band, that candle will be called a signal/alert candle.
Initiate a Buy trade when that alert candles high is broken. SL will be below low of that alert candle.
Risk to reward ratio will be 1:4 i.e. target will be 4 times the SL.
other rules for Options buying:- minimum 15min timeframe
The day you initiate the position , you should be in profit above 10%-15% then only you should carry forward that position overnight, otherwise squareoff your trade on that day only.
Buy ATM or slightly OTM, SL max 100 points , target 1:4
for Long-term/Investing :- Minimum Weekly
If candle is outside the lower band then initiate a Buy trade when that candles High is broken. Sl will be below Low of that candle.
for Long-term Target will be according to your emotions.
3. Power of Stocks - 5ema Strategy (target minimum 1:3)
Timeframe -
5 min for Selling (Sell Futures/index/stocks or buy Put)
15 min for Buying (Buy Futures/index/stocks or sell Put)
for selling stocks :-
you should enter trade within 10am , don't look for entries after that time. take only 2 entries a day.
for selling Index(Banknifty) :-
you can take trade at anytime of the day whenever conditions get satisfied. you can take multiple entries in banknifty as it is very volatile.
for options choose atm strikes: selling trade
sl for premium between 200-300 :- 20-30 points SL
sl for premium between 400-500 :- 40-50 points SL
sl for premium between 500-600 :- 50-60 points SL
Subhashish Pani's (power of stocks) 5 EMA Strategy:-
It plots 5 EMA and Buy/Sell signals with Target & Stoploss levels.
What is Subhashish Pani's (power of stocks) 5 EMA Strategy :-
His strategy is very simple to understand. for intraday use 5 minutes timeframe for selling. You can sell futures, sell call or buy Puts in selling strategy.
What this strategy tries to do is , it tries to catch the tops, so when you sell at top & it turns out to be a reversal point then you can get good profit.
this will hit stop losses often, but stop losses are small and minimum target should be 1:3. but if you stay with the trend you can get big profits.
According to Subhashish Pani this strategy has 60% success rate.
Strategy for Selling (Short future/Call/stock or buy Put)
When ever a Candle closes completely above 5 ema (no part of candle should be touching the 5ema), then that candle should be considered as Alert Candle.
If the next candle is also completely above 5 ema and it has not broken the low of previous alert candle, Then the previous Alert Candle should be ignored and the new candle should be considered as new Alert Candle.
so if this goes on then continue shifting the Alert Candle, but whenever the next candle breaks the low of the Alert Candle we should take the Short trade (Short future/Call/stock or buy Put).
Stoploss will be above high of the Alert Candle and minimum target will be 1:3.
Strategy for Buying (Buy future/Call/stock or sell Put)
When ever a Candle closes completely below 5 ema (no part of candle should be touching the 5ema), then that candle should be considered as Alert Candle.
If the next candle is also completely below 5 ema and it has not broken the high of previous alert candle, Then the previous Alert Candle should be ignored and the new candle should be considered as new Alert Candle.
so if this goes on then continue shifting the Alert Candle, but whenever the next candle breaks the high of the Alert Candle we should take the Long trade (Buy future/Call/stock or sell Put).
Stoploss will be below low of the Alert Candle and minimum target will be 1:3.
Buy/Sell with extra conditions :
it just adds 1 more condition to buying/selling
1. checks if closing of current candle is lower than alert candles closing for Selling & checks if closing of current candle is higher than alert candles closing for Buyling.
This can sometimes save you from false moves but by using this, you can also miss out on big moves as you'll enter trade after candle closing instead of entering at break of high/low.
Note :- According to Subhashish Pani Timeframe for intraday buying should be 15 minutes Timeframe.
If you haven't understood the strategy by reading above description, then search for "Subhashish Pani's (power of stocks) 5 EMA Strategy" on YouTube to get a deeper understanding.
Note:- This is not only for Intraday trading , you can use this strategy for Positional/Swing trading as well. If you use this on Monthly Timeframe then it can be very good for Long Term Investing as well.
Rules will be same for all types of trades & Timeframes.

Bollinger BandsThis strategy is inspired from Power of Stock aka Subhasish Panni.
Target is minimum 1:3 when you get this setup right.
Buy when:
1) Low is greater than upper band of BB and next candle breaks high of that candle, SL is Low of previous candle which is has low above upper band.
2) High is lower than lower band of BB and next candle breaks high of that candle, SL is low of previous candle which has high lower than lower band.
Sell when:
1) Low is greater than upper band of BB and next candle breaks low of that candle, SL is high of previous candle which is has low above upper band.
2) High is lower than lower band of BB and next candle breaks high of that candle, SL is high of previous candle which has high lower than lower band.
Disclaimer: this setup will cause many small stoploss hit, you have to accept that loss but you will be profitable because of R:R.

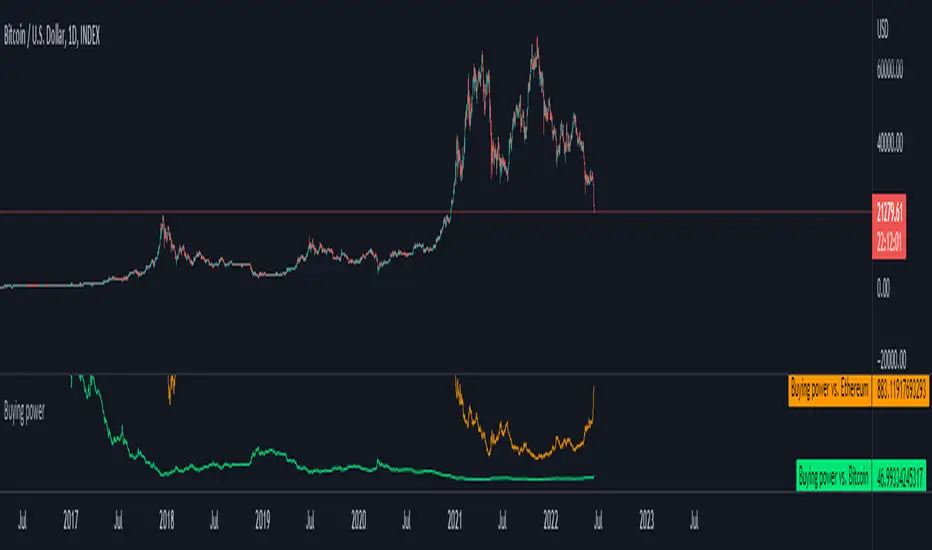
Buying power against Bitcoin and EthereumI created a simple tool where you can input your capital (in USD) and it will track your buying power against Bitcoin and Ethereum.
A handy tool for Dollar Cost Averaging and trend following systems.
Default value: You have 1000$
Formula: Buying power = Capital / Underlying assets
Combo 2/20 EMA & Bear Power This is combo strategies for get a cumulative signal.
First strategy
This indicator plots 2/20 exponential moving average. For the Mov
Avg X 2/20 Indicator, the EMA bar will be painted when the Alert criteria is met.
Second strategy
Bear Power Indicator
To get more information please see "Bull And Bear Balance Indicator"
by Vadim Gimelfarb.
WARNING:
- For purpose educate only
- This script to change bars colors.
[Max] Power lag analysis An indicator that is a parametric lag power filter.
I'm starting Time Series Analysis by Hamilton James Douglas, to try to find some fun ideas to test and upgrade my skills on that subject and share them when it produce something that can be useful.
The idea behind that indicator, it's to only get the shape of the biggest movement in percent.
To solve that problem, I iterate about the rate of change of about 15 intervals and I apply a bigger power to the intervals that get bigger.
Why ? If the price is ranging, the indicator will show only the spics, but if the price breakout of the range, each new close that are longer from the price will have a better impact on the indicator and the last ones will be neglected.
I've try to use some parametric lag indicators on top of that indicator but he result is not good enough for me, it can't be used for trade directly but it can be an approach.
If you have upgrade ideas or recommendations on that indicator, I will be please to hear them.
Have fun with the script.
Have a great day !
Max

ALT_FLAMES00.00 - alt-flames
component breakdown:
a) various combinations of EMA crossovers taken from the primeval_series to create a complete sequence of background colored-lines that subdivide into a bullish portion
and a bearish portion for directional identification
b) specific macd crossovers for predictive power in the form of directional flames located directly above the chart price (navy & yellow flames)
c) unique fast & slow rsi combinations for momentum + strength in the form of power flames located directly above the chart price (orange, red, green, & lime flames)
when the alternation of flames are used in concert with the sequence of background colors, one can identify impending explosive price action, can better navigate through periods of slower activity, identify where they are currently in the trend's lifecycle and, MOST IMPORTANTLY, improve the TIMELINESS of entry and exit strategies
00.01 - primeval_series - overview
the primeval_series is a group of transformed universally-renowned mathematical constants that have been transformed and embedded into a series of EMAs
each of these EMAs relates in some meaningful way to the "original wave' or 'wave_0': i.e. the wave that began at t=0, when humanity first made technological progress
the transformations made ensure that the inherent linkages to the original wave remain intact while being applicable to the structures inherent to indicator development
for the purposes of the alt-flames indicator, certain numbers selected from the primeval_series exist and are the basis of each ema , MACD and RSI calculation made herein
00.02 - alt-flames - best practices, and ideal targets
for best use: start with the daily timeframe for broad pattern, then use hourly going forward
ideal for swing trades, shorter-term options, and stocks that already have well-established uptrends, but have also started consolidating for 1+ week
patience is required to catch the ideal break, so best to use mildly OTM calls with at least 2 weeks on them before expiry.
for great use: pick out stocks that have recently broken out heavily from their pivot . Do not enter until the retracement from the top has a defined local low
for average use: any sort of intraday play. this tool is meant for swing trades and sustained breakouts. picking out significant bottom reversals.
the MACD portion is not geared for big reversals here. Rather, it is complementary to the EMA sequences, which are at the core of the indicator
not useful for: shorting stocks that are trending downward or that are in sideways trends

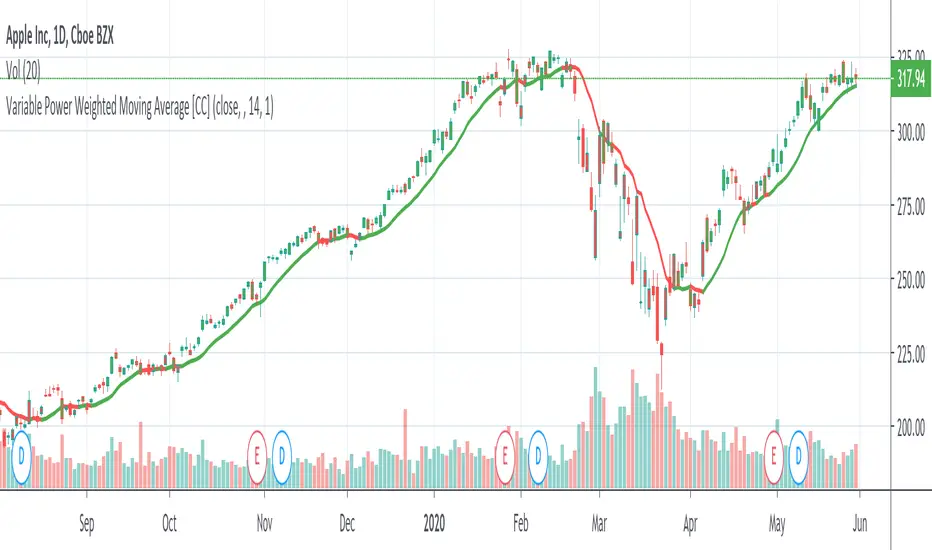
Variable Power Weighted Moving AverageThe Variable Power Weighted Moving Average was created by RedKTrader so make sure you follow them! This is a very handy indicator where you can change the weights of the weighted moving average yourself!
For an easy guide here are common values to use to convert this indicator into other indicators:
Power = 0 = Simple Moving Average
Power = 0.5 = Square Root Weighted Moving Average
Power = 1 = Weighted Moving Average
Power = 2 = Squared Weighted Moving Average
Try it out and let me know what you think!
Let me know if you have other ideas for me or if you want something custom done!
Price's PowerValue of Price's Power define the current price is equal to how many times the standard deviation of the Exponential Moving Average
CyclePeriod is the time period to be used in calculating the Exponential Moving Average.
Price's Power cross over zero line: bull power begin stronger.
Price's Power cross under zero line: bear power begin stronger.
Price's Power = 0: market is choppy.

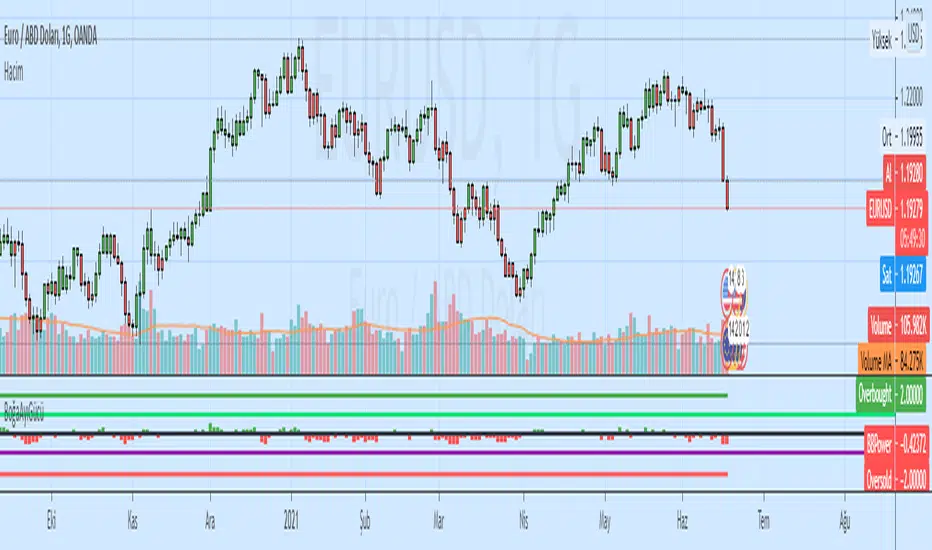
Elder Ray Bull and Bear Power OscillatorsElder Ray Bull and Bear Power Oscillators
Tradingview Screener Bull Bear Power(BBPOWER)
OVERVIEW
The Bull and Bear Power oscillators developed by Dr Alexander Elder attempt to measure the power of buyers (bulls) and sellers (bears) to push prices above and below the consensus of value. The primary principles on which Elder based the oscillator are:
The highest price displays the maximum buyer’s power within the day.
The lowest price displays the maximum seller’s power within the day.
The moving average can be construed as a price agreement between buyers and sellers for a given time period.
The Bulls/Bears power balance is important since changes in this balance can signal the early stages of a potential trend reversal.
CALCULATION
Elder uses a 13-day exponential moving average (EMA) to indicate the consensus market value.
Bull Power is calculated by subtracting the 13-day EMA from the day’s high.
Bear Power is derived by subtracting the 13-day EMA from the day’s low.
TRADING WITH THE ELDER RAY BULL AND BEAR POWER OSCILLATORS
BULL POWER
Where a currency uptrend is sustained to the point that maximum prices move above the EMA the Bull Power histogram will be greater than zero. As price maximums accelerate to greater levels (above the EMA) during the rising trend histogram bars will increase in height above the zero line showing the increased buying strength during the period.
BEAR POWER
Where a currency downtrend is sustained to the point that minimum prices move below the EMA the Bear Power histogram will be less than zero. As price minimums accelerate to lower levels (below the EMA) during the falling trend histogram bars will increase in height below the zero line showing increased selling strength during the period.
TRADING SIGNALS
It is important for traders to use the Elder Ray oscillators in conjunction with the EMA overlay over the price chart (typically as per period being analysed) to give additional context to the signals. Sell signals are given if Bull Power is above zero and there is a bearish divergence in the Bull Power histogram or if the Bull Power histogram is above zero and falling.
Buy signals are given if Bear Power is below zero and there is a bullish divergence in the Bear Power histogram or if the Bear Power histogram is below zero and rising. It is extremely important for traders to only trade in the above scenarios if the direction of the trend indicated by the slope of the EMA on the price chart is in the direction of their trade when the signal is given (or shortly after).


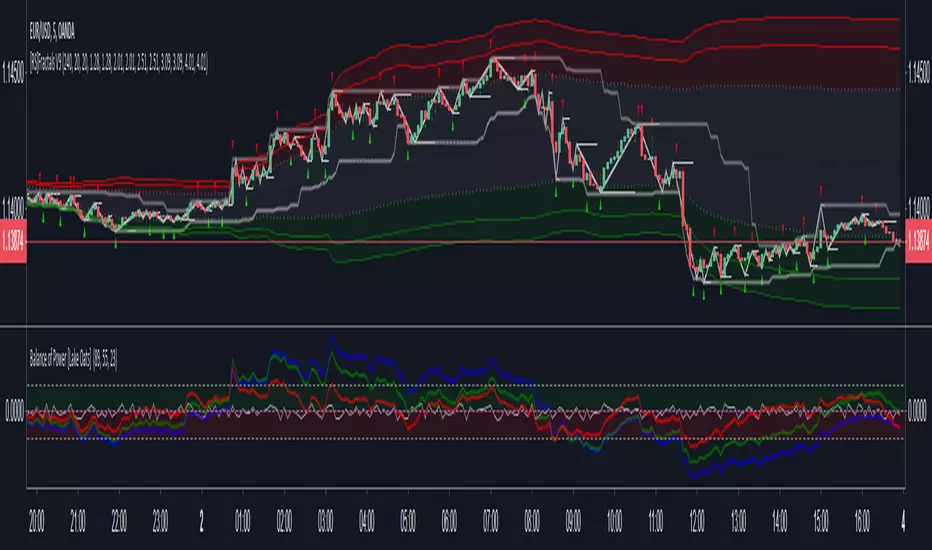
Balance of Power [Lake Oats] Balance of Power indicator - Useful tool for finding great Timing upon Entering Postions and Existing Postions, Also Useful for finding Normal and Hidden Divergences
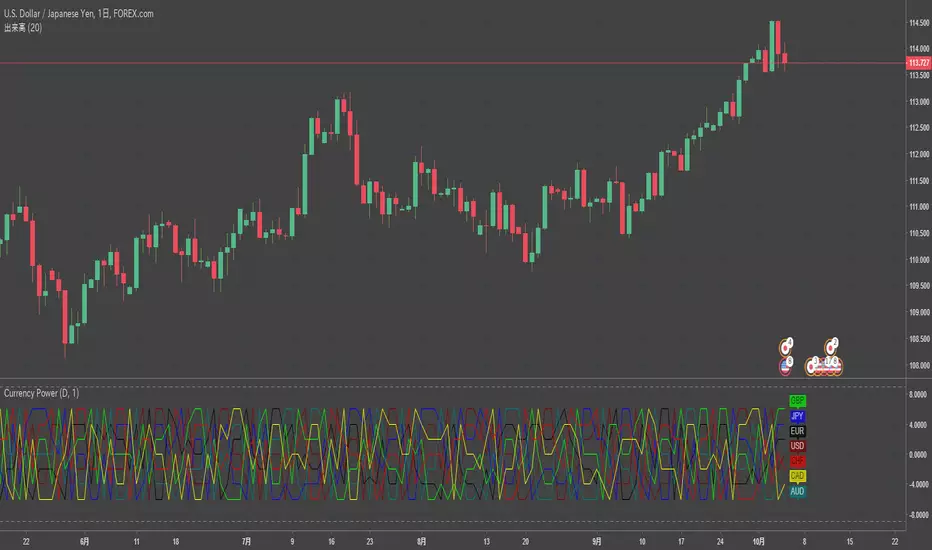
Multiple Majors Currency Basket Power Oscillatorthis script by RichardoSantos
description
--
Power oscillator to discern what currency's are stronger/weaker.
added option to use a smoothed source(close) for pooling the change, giving longer term directional bias, note that this causes lag in the results as MA's turn slower than price.
--
I added currency labels and changed line color only.
Power LineA flexible combination of price and volume rate of change. Signals (sources) can be combined to create familiar indicators like On Balance Volume (OBV), or creativity inspired indicators.
The default settings multiply the change in price (flow) by volume (pressure) which is “money” or “power” (like in an electrical circuit). But, any combination of signals can be multiplied/divided... which might be “power", or something else.
See script comments for full details.
This indicator complements the “Multi Oscillator” indicator:
There are many similarities, but “Power Line” plots one line over price: either as an oscillation type signal or it’s integral, which tracks price in some relationship. The Left Axis is used for scaling.
While this indicator is handy for trading decisions, it's highly educational. It has allowed me to get a feel for other well known indicators, like On Balance Volume (OBV), Chaikin Money Flow (CMF), Accumulation/Distribution Lines (ADL), Money Flow Index (MFI)... and others. And in this process, other composite signals unfold quickly. Let your creativity go!


D_Three Ten Osc Strategy Backtest This indicator allows the user to plot a daily 3-10 Oscillator on a Tick Bar Chart or any intraday interval.
Walter Bressert's 3-10 Oscillator is a detrending oscillator derived
from subtracting a 10 day moving average from a 3 day moving average.
The second plot is an 16 day simple moving average of the 3-10 Oscillator.
The 16 period moving average is the slow line and the 3/10 oscillator is
the fast line.
For more information on the 3-10 Oscillator see Walter Bressert's book
"The Power of Oscillator/Cycle Combinations"
You can change long to short in the Input Settings
Please, use it only for learning or paper trading. Do not for real trading.

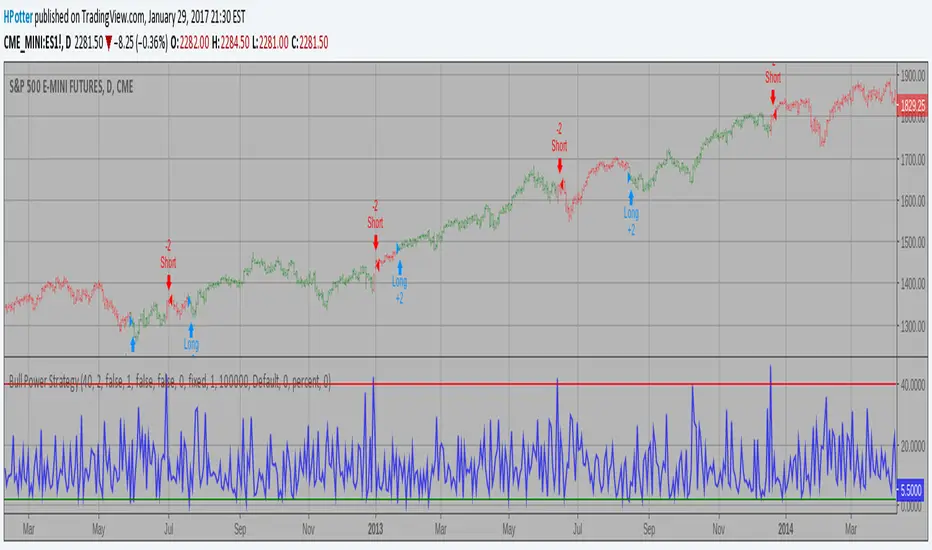
Bull Power Strategy Backtest Bull Power Indicator
To get more information please see "Bull And Bear Balance Indicator"
by Vadim Gimelfarb.
[RS]Multiple Majors Currency Basket Power Oscillator V1Power oscillator to discern what currency's are stronger/weaker.
added option to use a smoothed source(close) for pooling the change, giving longer term directional bias, note that this causes lag in the results as MA's turn slower than price.
